Optimizing crop yield, vigor and uniformity

Blog


Starting Pollen Systems

Keith McCall, Founder and CEO

Keith McCall

The last two companies I founded were focused on delivering value and cost savings by using data analytics (now known as Big Data) to optimize business processes. I spent 12 years developing solutions to help companies run email 7x24 by outsourcing remote management of their servers to Azaleos and then built Enroute Systems to help retailers ship packages more efficiently: picking the right carrier and the right service to deliver packages to homes around the world.

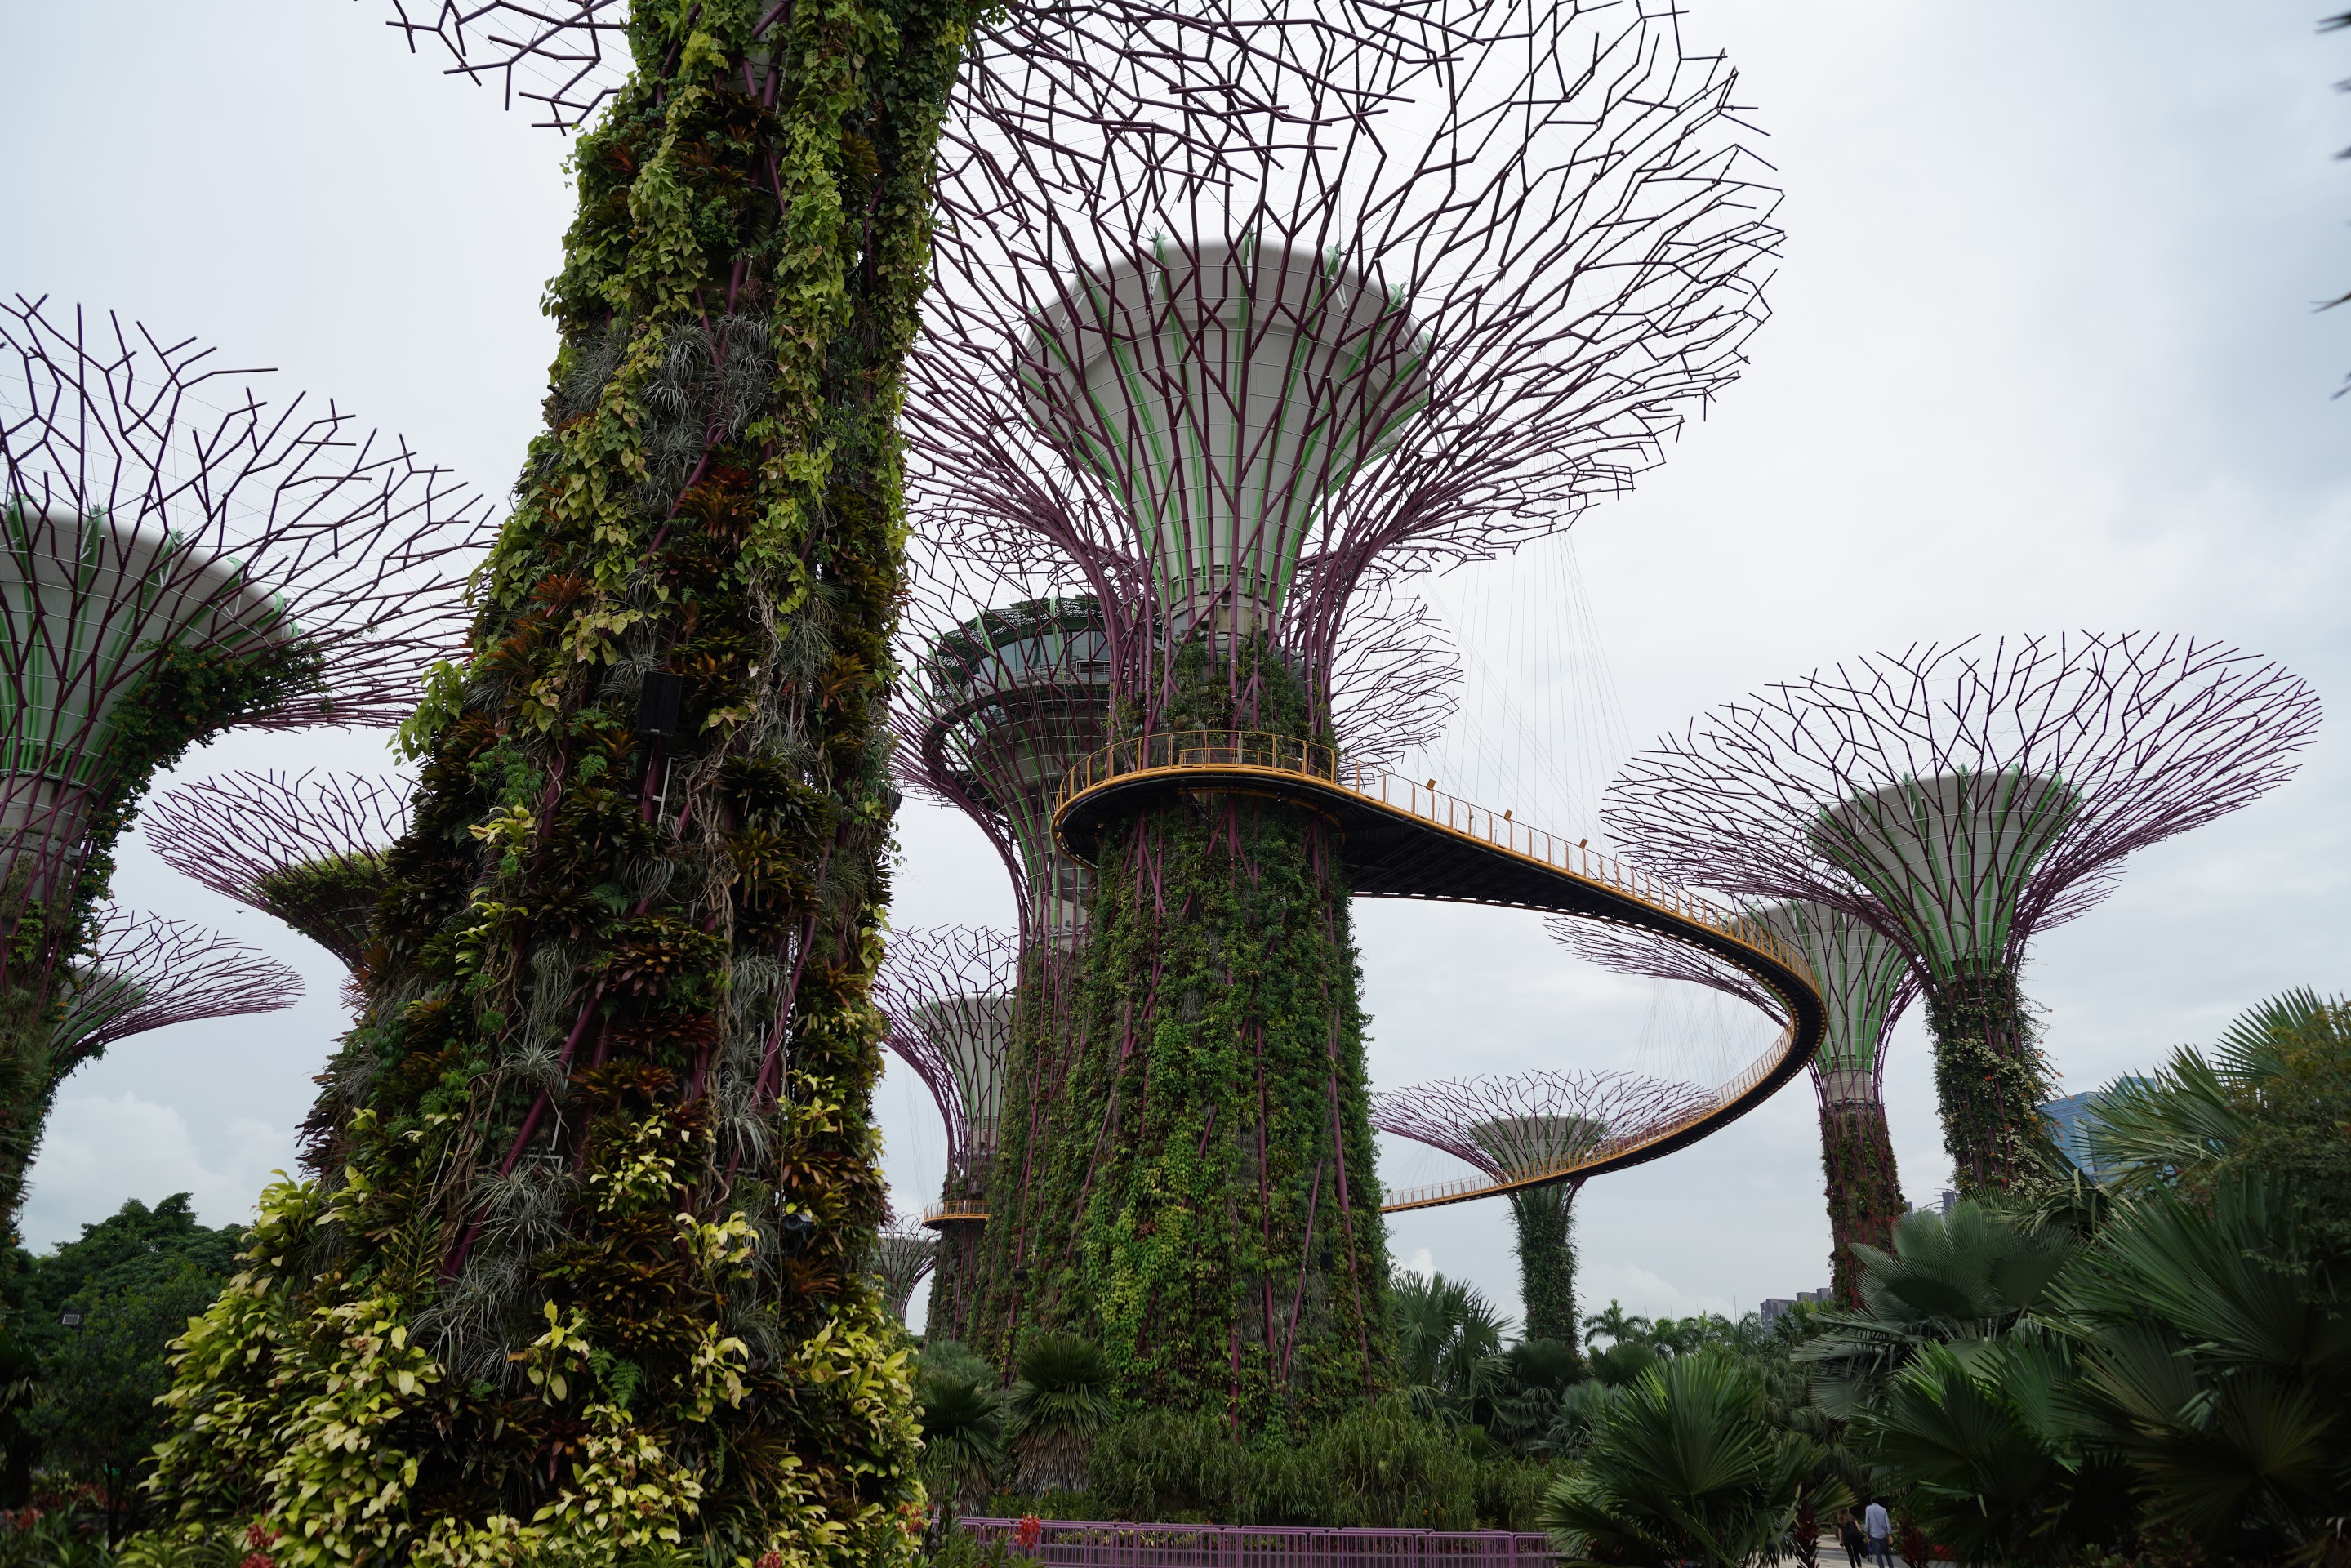
In June 2018, while on a year sabbatical after building and selling my latest startup, I visited Singapore with my family. One of my passions and hobbies has always been gardening: determining how to make plants grow. In Singapore, I discovered the Gardens by the Bay and the Supertree Grove. On a series of man-made 80-160 foot vertical frames, city planners have applied environmental technologies that mimic the function of regular trees, and planted the trees with tropical flowers, ferns, and other plants.

This spurred me to think about the application of advanced data analytics as applied to the agricultural industry, and to explore the possibilities. Pollen Systems was named after the restaurant at the Gardens by the Bay, but symbolizes much more.

To us, Pollen represents data, visible and invisible, that pervades farmlands worldwide. Pollen Systems harvests that data and turns it into actionable insight before it blows away. Check out our site to learn more, or contact us at [email protected].

A day in the life of an Agricultural Technologist

Drew Falabella, Director of Agricultural Solutions

Drew Falabella

An Agricultural Technologist mainly does two things that keep Pollen Systems flying: researching crops and drawing maps! Agricultural Technologists are often studying ways to improve our analytics and best serve our customers. However, the bulk of the work during the Pacific Northwest growing season is analyzing imagery collected by our pilots and packaging it into periodic updates for our customers.

Importing Images for Processing

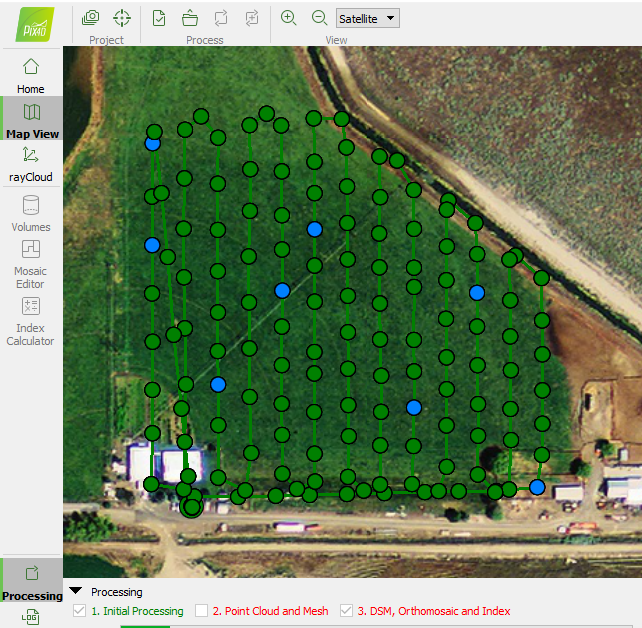
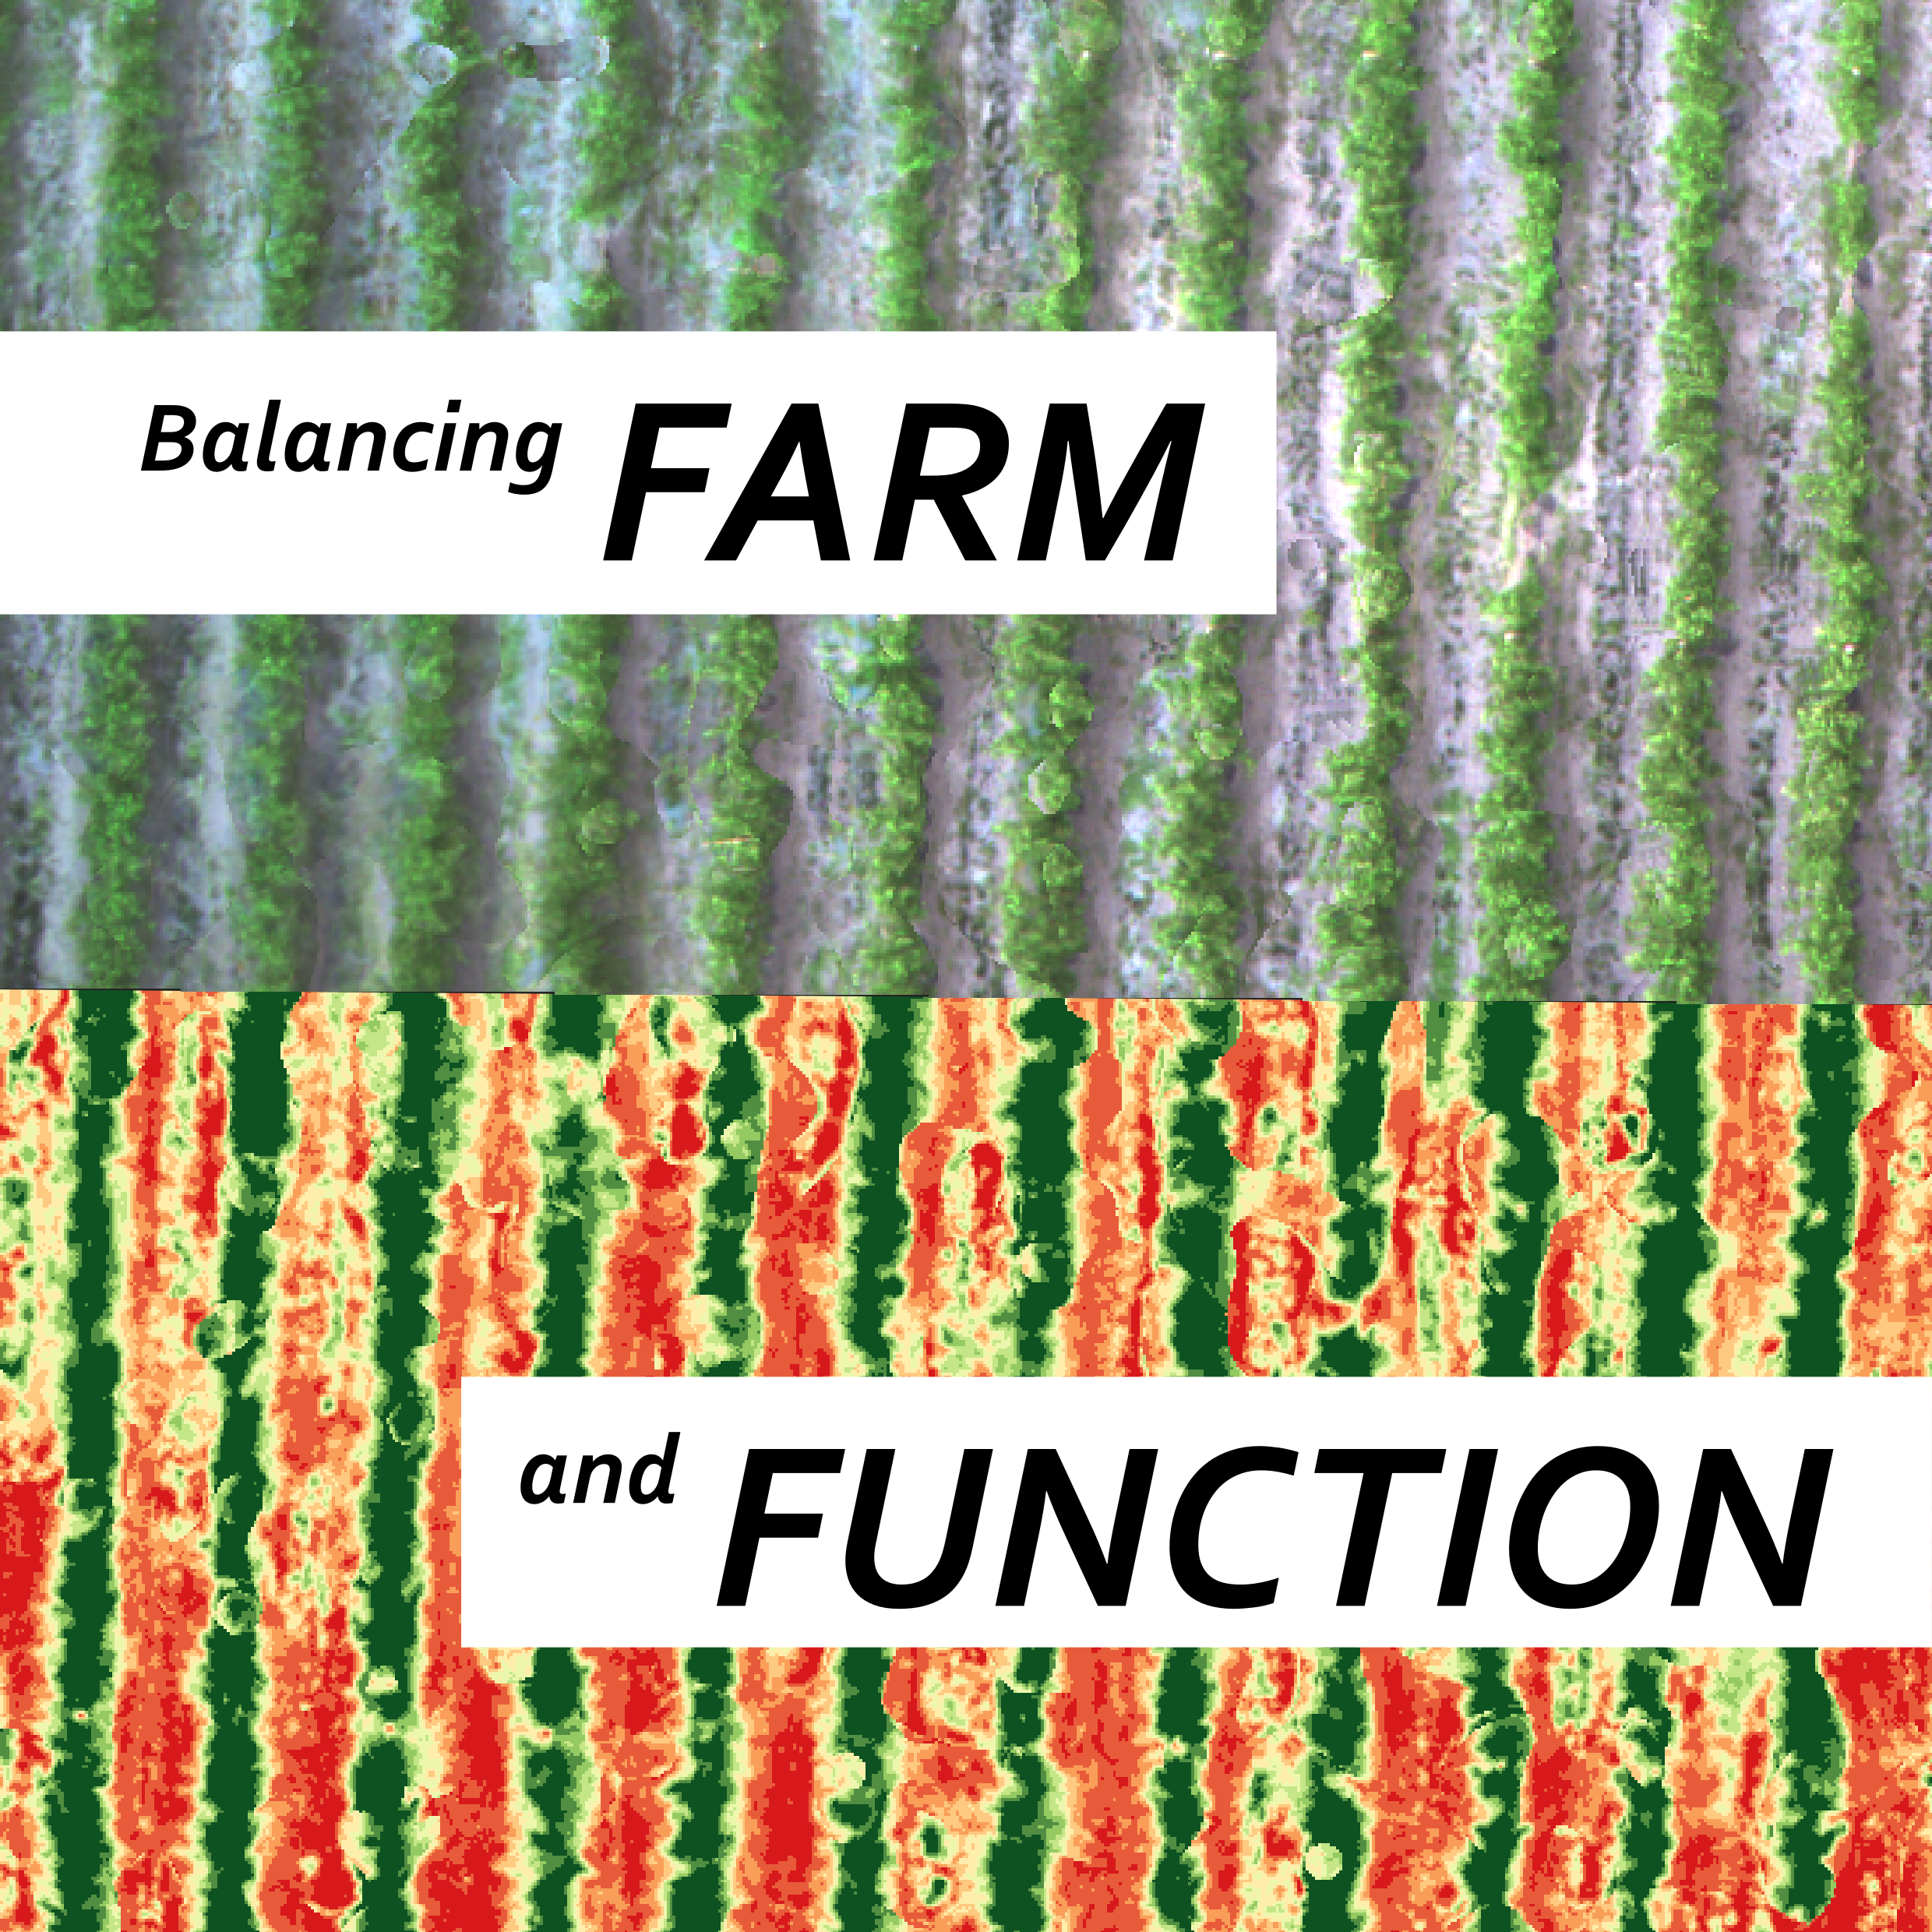
The process begins with importing thousands of aerial images into our PrecisionView Engine, our proprietary software for composing a single mosaic that we can work with. We also use the Engine to translate the raw data captured by our sensors into NDVI and NDRE health indices that help us analyze our customers’ crops. After color-coding and displaying that health data on a map, the result is a high-resolution picture used to identify patterns in growth or plant stress.

Balancing Farm and Function

Once the analysis is complete, we write a scouting report delivered to the Precisionview Manager portal and directly to your email inbox. This summarizes everything we have learned in our most recent flyover, including a breakdown of our flights field by field. We also incorporate a map that shows the areas of greatest and lowest plant health, allowing us to pinpoint areas that could use extra attention. Ultimately, this information allows us to offer management suggestions to maintain a healthy crop.

What it's like to fly drones for Pollen Systems

Nathan Albright, Drone Technologist

Nathan Albright

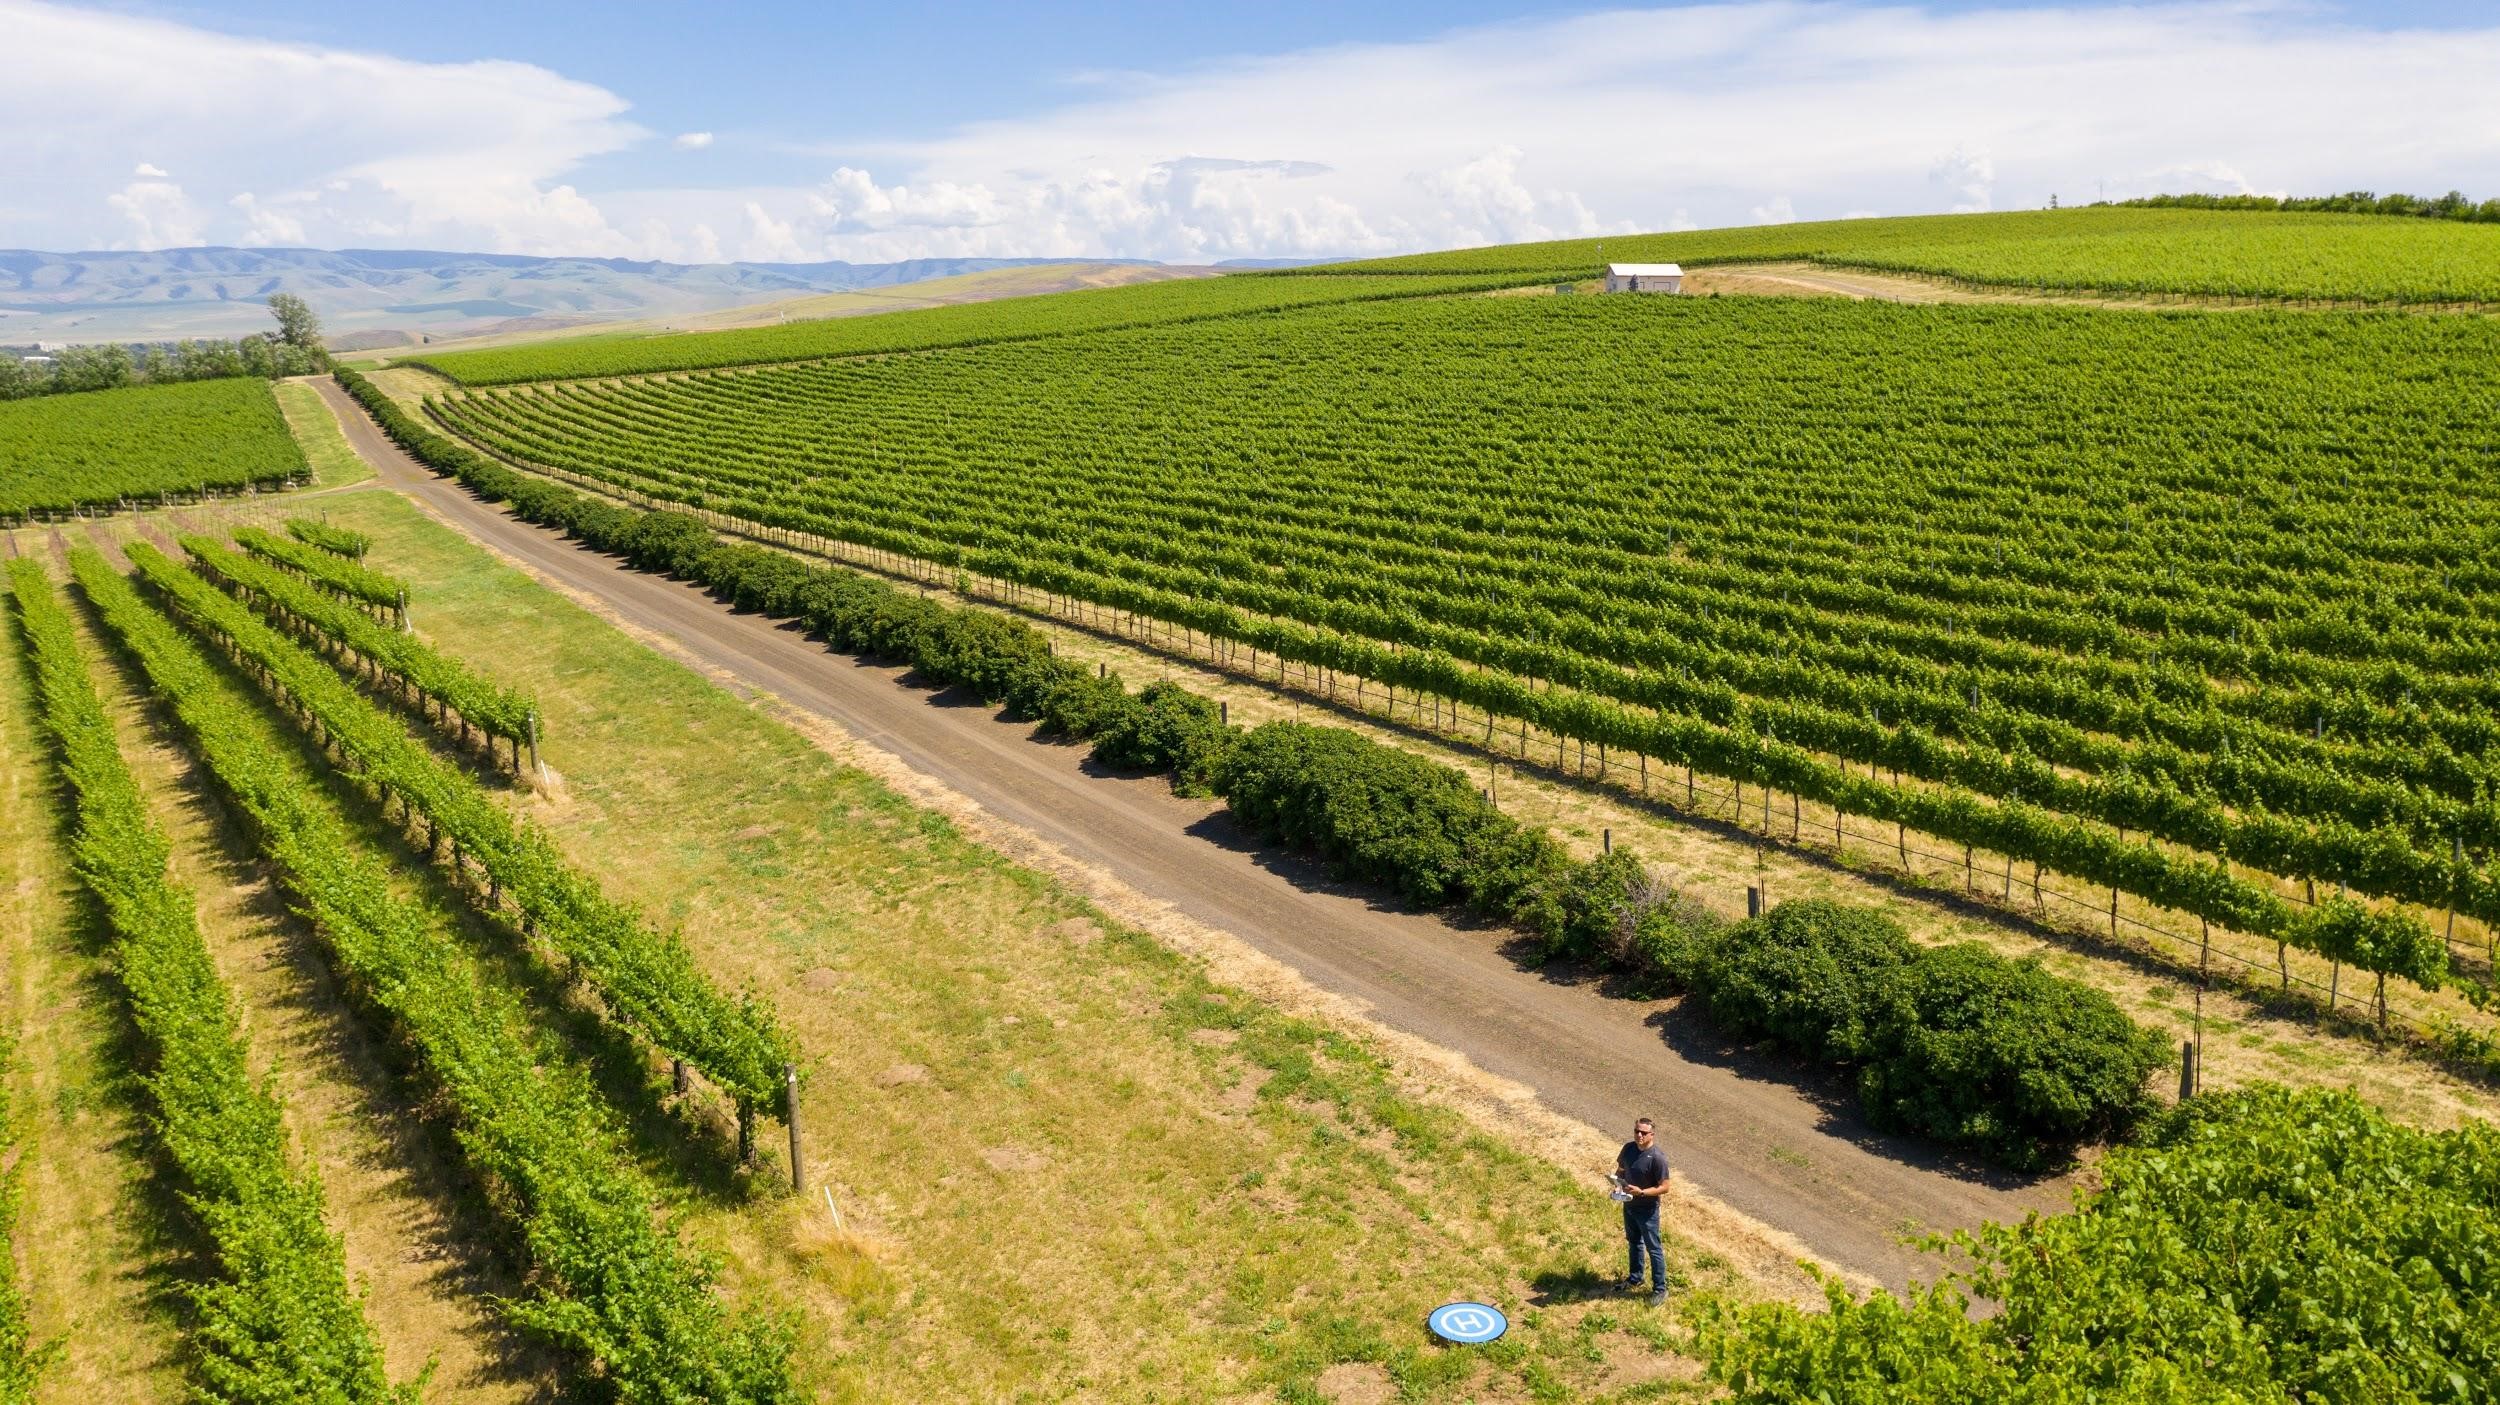
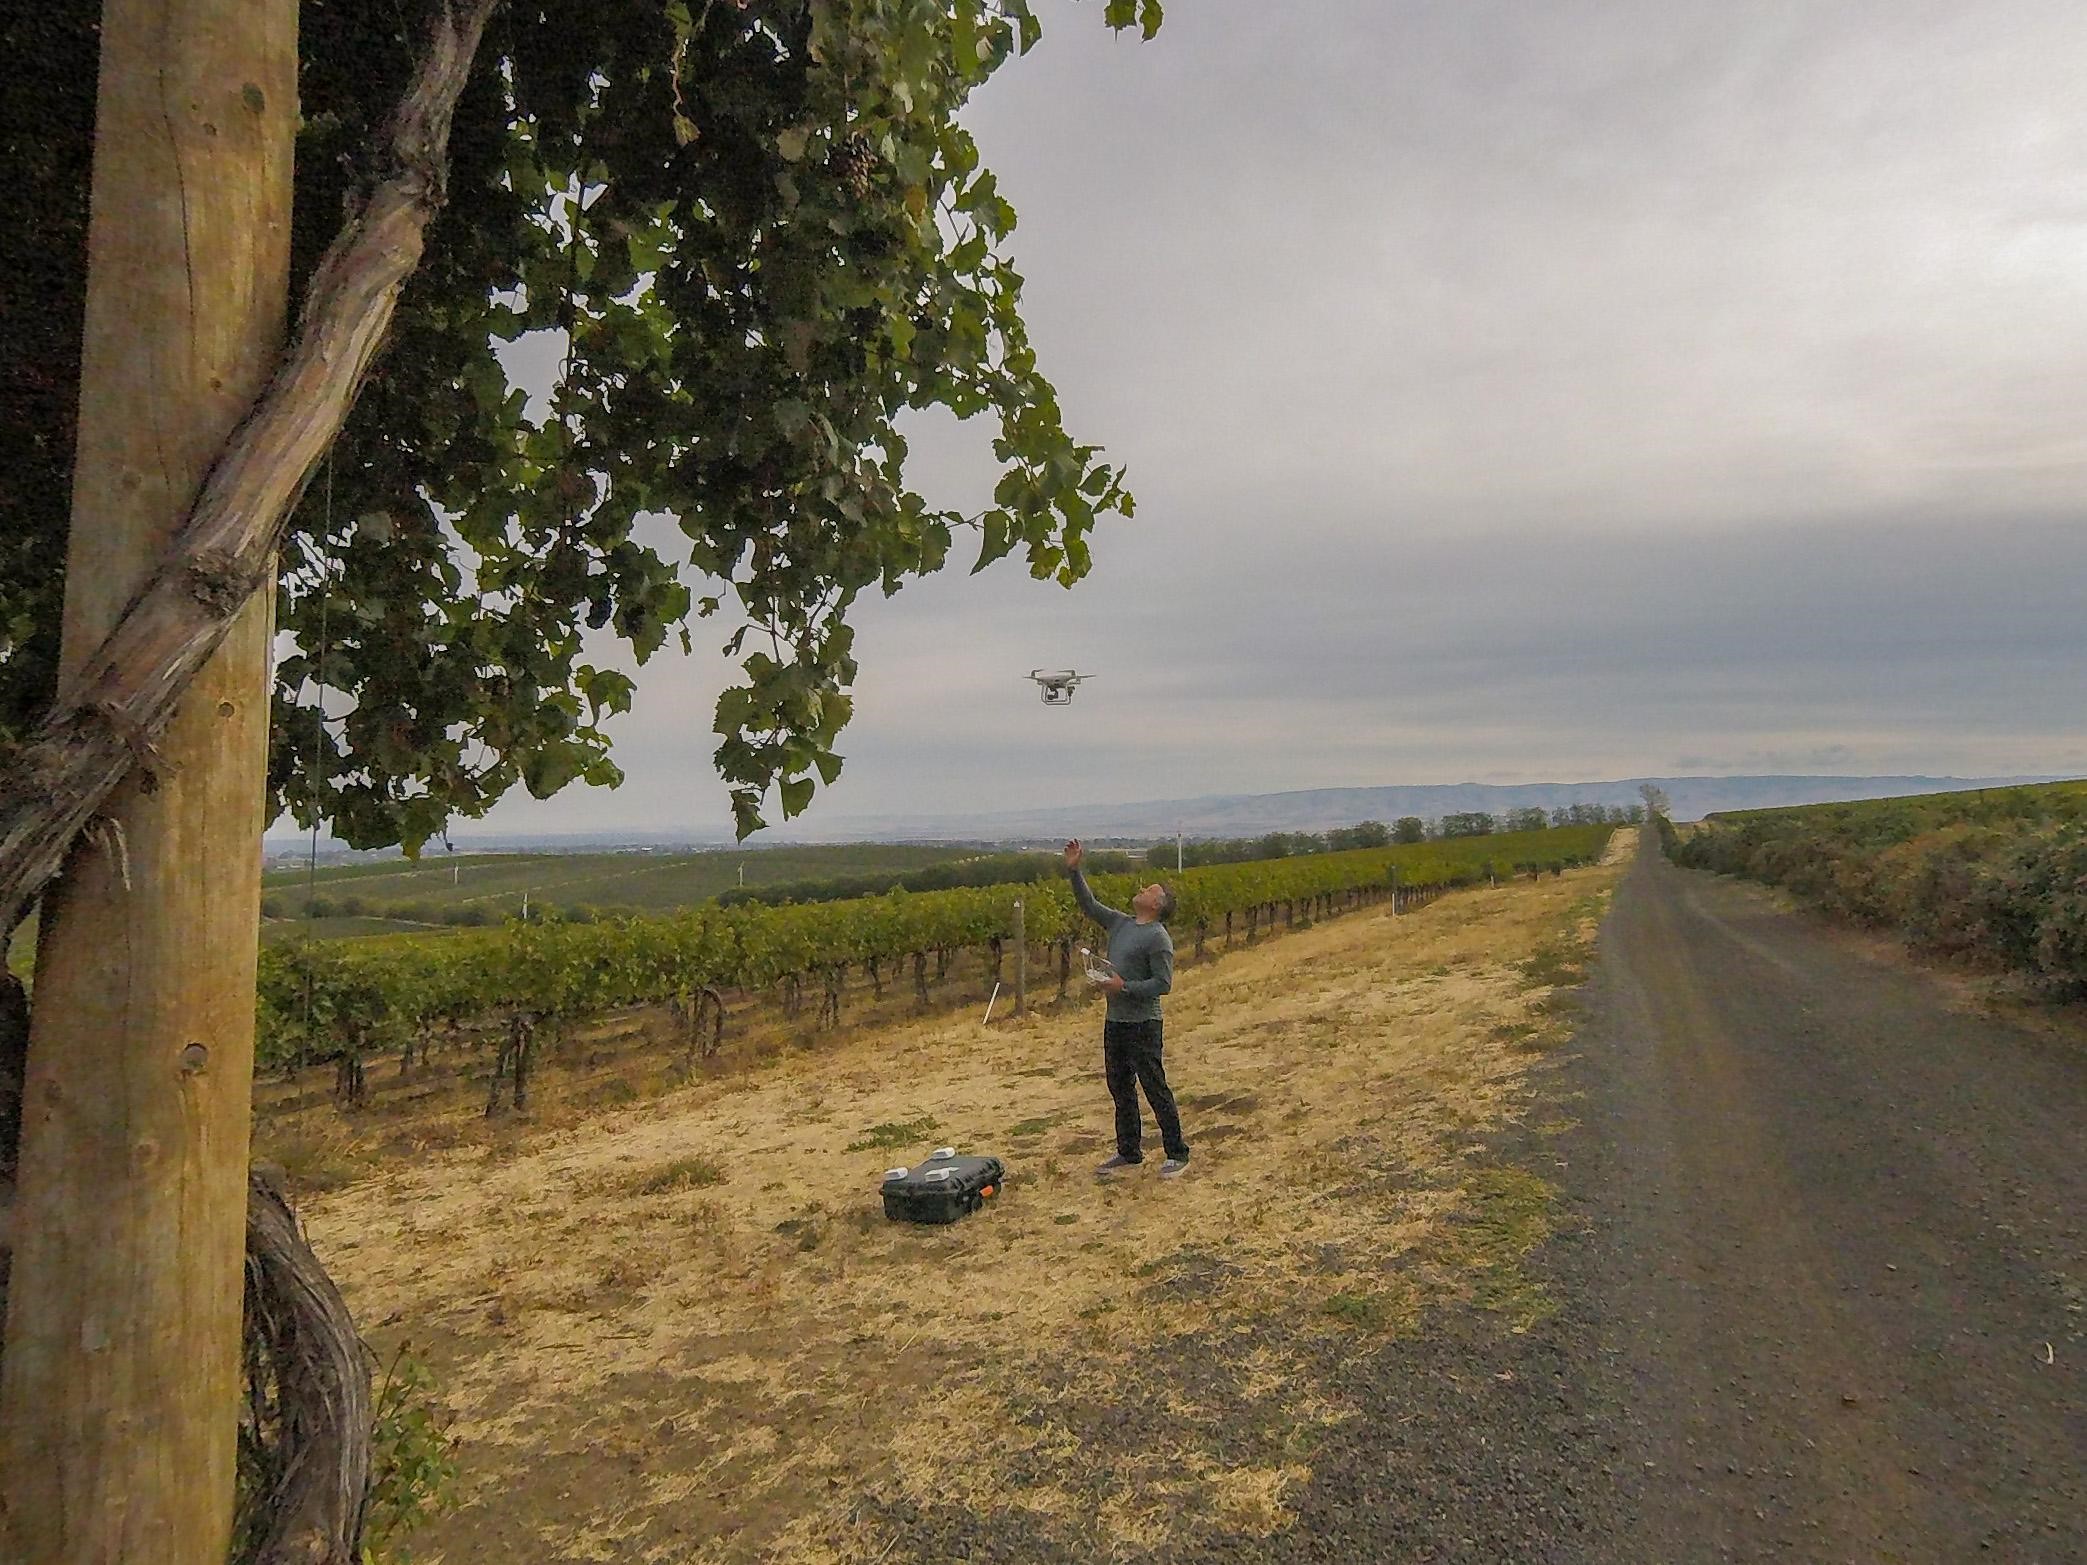
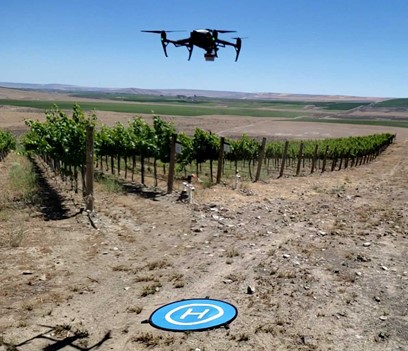
Pollen Systems is on the cutting edge of agricultural technology, and this summer marks my third year as Pollen Systems’ primary drone pilot in Washington and Oregon. If you are one of our clients, then you may have seen me on site previously with a Phantom 4 Pro, but our latest tool is a DJI Inspire 2 with a MicaSense Altum sensor, which has the multispectral and RGB imaging that clients have traditionally received, plus we have sharper imaging and now have the availability of thermal readings.

Flying Drones over crops

I live in Moses Lake but travel throughout Washington and Oregon, most frequently to Benton City’s Red Mountain AVA, Walla Walla’s AVA’s vineyards stretching across the state border into Oregon, Royal City, George, Yakima, and several other sites along the Columbia River.

With well over 500 hours of drone flight time, my drone flying experience and expertise helps me contribute to the team by ensuring that any flights over your farm are not only safe, but produce the highest-quality images to offer farmers the best information available to stay on top of their crops, whether they’re grapes, apples, pears, cherries, or even cannabis, used in making marijuana.

Flying Drones over wine grapes

We aren’t the only company offering spectral imaging to farmers. Some imaging is done by satellites with much lower resolution (generally one pixel of the image represents 32 feet) and manned aircraft offer images that are a little sharper (approximately 50 inches per pixel), but drones are able to provide images of 2 inches per pixel. Not only do drones help farmers see what’s going on in their field with much more accuracy, but when the West Coast endured fires over the last couple of summers, satellite images and manned aircraft were unable to provide images to farmers. The smoke didn’t slow us down at all. Of course, we fly at 400 feet rather than 8,000 feet or 488 miles above earth.

Pollen Systems isn’t just a guy who stops by to take pictures of your farm, but includes a large team, each with our own specialties that we bring to the table, whether it’s drone flying, image processing, or coding a portal with a great format for all of the information to be easily digested by the farmer. Contact us if you’re ready to increase your farm’s crop yields and quality.

Canola Farms in the Snake River Area

Trina Nelson, Director of Integration and Customer Experience

Trina Nelson

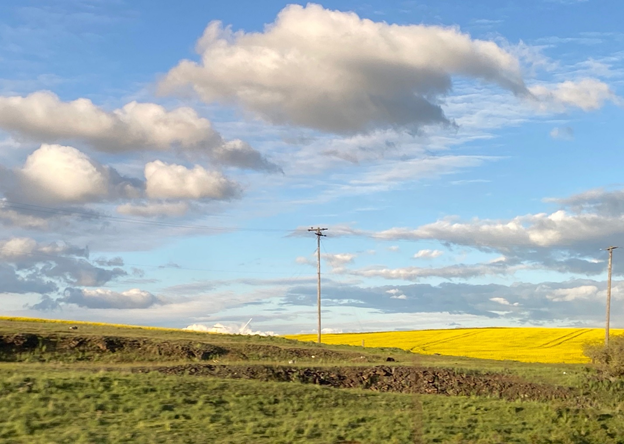
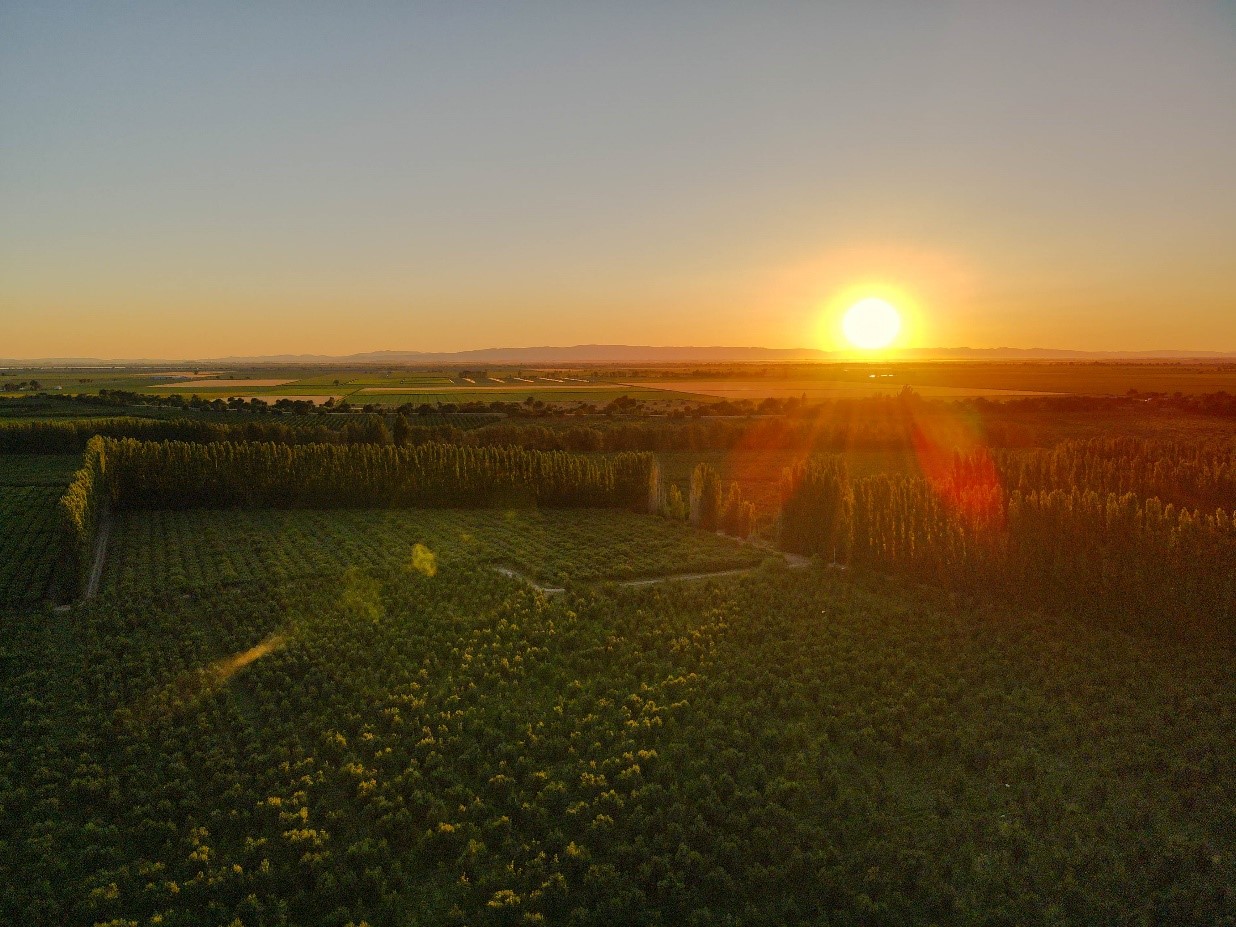
This past Memorial Day weekend the promise of great trout fishing in the Snake River led us across Washington state into Idaho and entertained us all with beautiful sites along the way. As the buildings and cars faded from view, the land opened up. The air got a bit fresher. The atmosphere a little quieter and colors more pronounced. But nothing stood out more than the glowing, yellow canola fields.

When I hear “canola” I immediately think of the oil we cook with but come to find out there are many more reasons for growing this beautiful crop besides impressing us travelers. So, I did some research!

Canola Fields in Idaho

Did you know, canola oil can also be processed to be used as biodiesel fuel? And, because of its high protein content, it can also be used in feed rations for beef cattle, poultry and fish.

Also very interesting, canola can be grown with or without irrigation. This is huge in dryland farming regions where water is scarce or regulated.

Because of the pest resistant properties of canola, it is a good candidate for crop rotation to prevent pest infestation in other crops. There is Winter canola and Spring canola so based on the growing season of the other crops, Winter or Spring canola can be used. Talk about a team player

Canola Flowers

Research into the canola crop broadens my knowledge of the co-existing and symbiotic relationship between crops and when I pass through again for some July 4th fishing I won’t only be taking in the beautiful fields but understand how they touch many different aspects of our lives.

My role as Director of Integration and Customer Experience at Pollen Systems includes presenting the data we collect from fields all over the world. As I travel across state lines marveling at the enormity of agriculture, I think about the amazing opportunities there are to provide data to our farmers to keep these helpful and sustaining canola fields flourishing as well as astounding us travelers with their beauty.

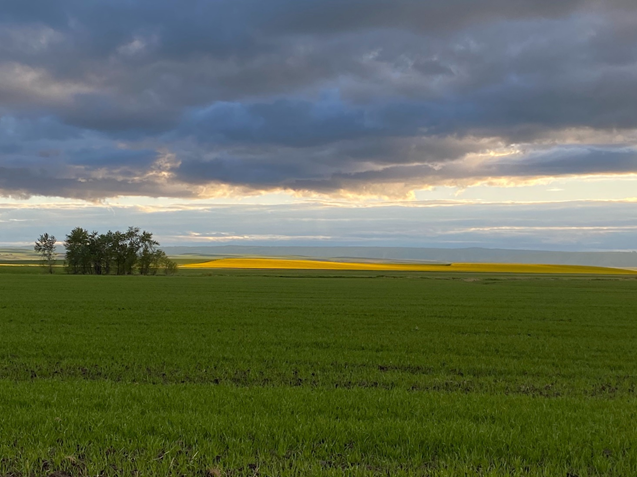
Canola Skyline in Idaho

The Elevator Pitch

Keith McCall, Founder and CEO

Keith McCall

At a young company, cash is king. You need to constantly be monitoring your expenses, while at the same time either bootstrapping or raising money from angel investors or venture capitalists to help grow the business.

One of the things that every Founder has to learn to do is a one minute "Elevator Pitch". Imagine seeing a famous investor as you ride the elevator to our floor. How fast could you pitch them your idea before you get to the top of the building?

Last year I had the opportunity to do this --- for real --- at Geekwire's Elevator Pitch Contest. You can view the episode here.

Keith McCall Geekwire Elevator Pitch

Our current one minute pitch (when properly executed) goes something like this:

Pollen represents data, visible and invisible, that pervades farms throughout the world. Pollen Systems harvests that data, turning it into actionable input that helps farmers grow better crops.

We fly drones and fixed wing aircraft, use IoT sensors and mobile devices to collect and process information, serving customers in Washington, Oregon, California and Chile.

Our patented process tells farmers how to better address issues such as water usage and pests and diseases

We started with wine grapes, but have since expanded into apples, cherries, kiwis, avocados, and many more crops.

Last year we raised $1 million in a seed round to build the business in North America and Chile and perform pilots in Peru and South Africa.

We are raising an additional $2 million Series A round to continue to expand into other crops and geographies. Please join us!

Data with Drew: Vegetation Indices

Drew Falabella, Director of Agricultural Solutions

Drew Falabella

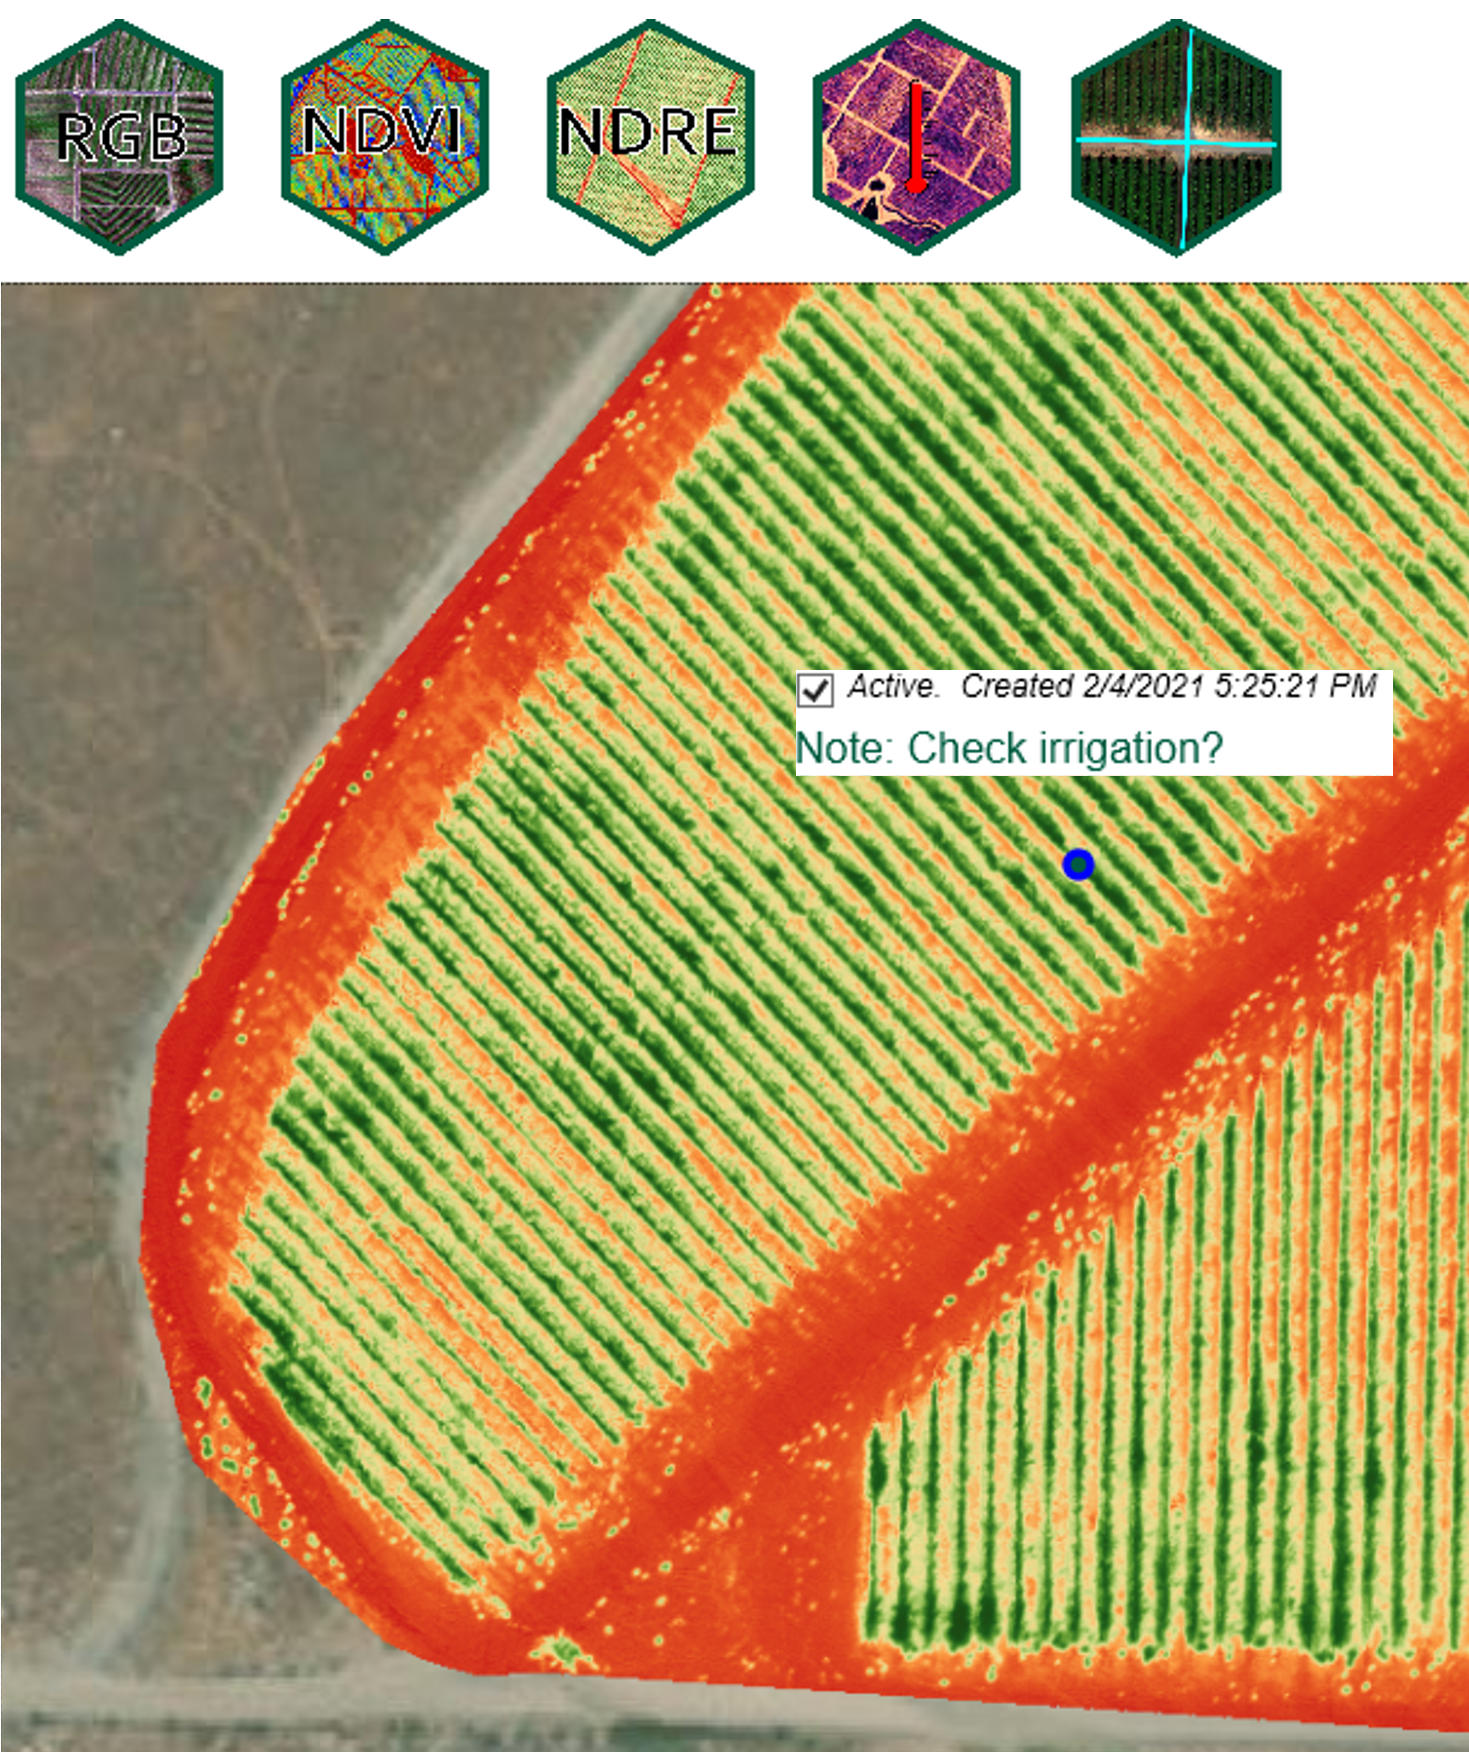
The cameras we use on fixed wing and drone aircraft capture visual picture images (RGB), near infrared images (NIR), and thermal images. A formula is used to analyse the NIR data returned and provides Pollen Systems with two main metrics to measure plant vigor: NDVI (Normalized Difference Vegetation Index) and NDRE (Normalized Difference Red Edge). These vegetation indices are each unique ways to assess the health of your fields, and offer helpful insights for farm management.

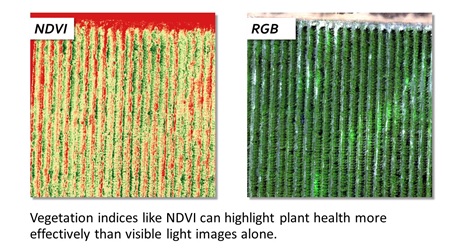
NDVI vs RGB

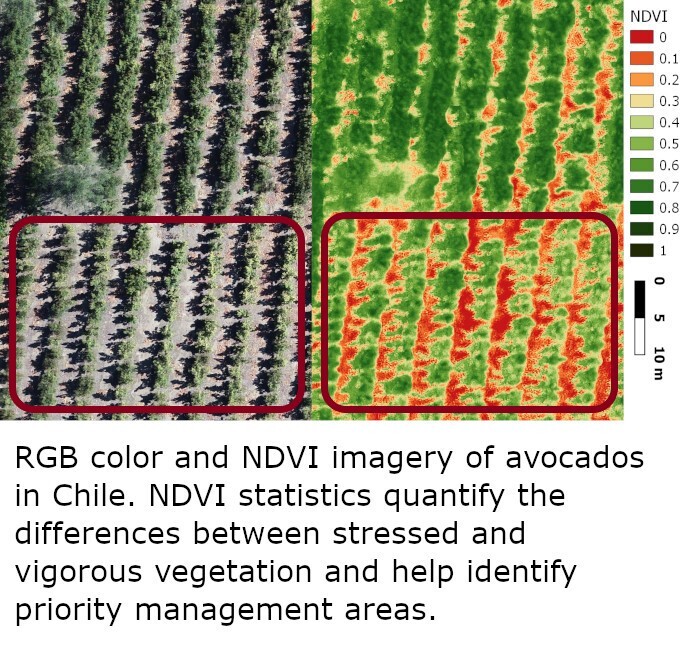
NDVI is one of the first indices designed to estimate the presence of vegetation in satellite images. It represents a ratio between light reflected by plants in the visible red light spectrum and the Near Infrared spectrum, and is related to the chlorophyll in those plants. the more chlorophyll present, the higher the index becomes. Therefore, we know it to be a solid estimate of photosynthesis in a plant, and by extension, plant health and vigor. It runs from -1 to 1, where -1 is represents water, 0 represents bare soil, and 1 represents extremely vigorous vegetation.

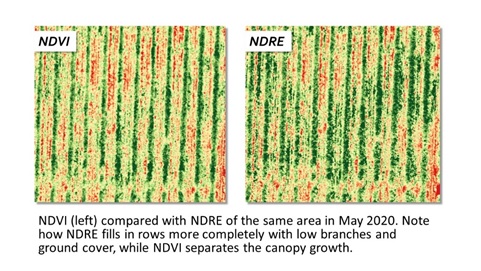
More recently, NDRE has emerged as another index that fills a role NDVI does not. While both estimate chlorophyll content, NDRE replaces visible red light with a wavelength that borders the infrared and visible red wavelengths: Red Edge. Since it does not rely on visible red light, NDRE can collect readings below dense canopy cover where NDVI is blocked. This is especially useful late-season to determine which plants need support.

NDVI vs NDRE

When looking at both maps together, we often see where canopy health is high compared to lower branches, or how to distinguish ground cover from crops of interest. Our partner Micasense produces cameras specifically designed to capture the wavelengths of light needed for NDVI and NDRE, and we are excited to continue using their technology in service of your farms and vineyards. Hopefully this has been a helpful reminder to keep learning and keep growing!

Calling California with Forrest Faszer

Forrest Faszer, Account Executive

Forrest Faszer

I may be considered new to the team at Pollen Systems, but what I am not new to is California’s Capital, Sacramento.

Sacramento

Coming from a farming family myself, I was born and raised here on the Sacramento River Delta, on one of my family’s very own pear and cherry orchards. Since there are so many farmers in Sacramento it seems fitting that it also holds the title of being the Farm-To-Fork Capital of the United States. Meaning Sacramento’s local restaurants, supermarkets, and (of course) farmers markets, offer some of the freshest produce, all made possible by our local farmers.

Sacramento Water Tower

One of our largest and most iconic crops here in California are our almonds. According to the Almond Board of California, the golden state grows 80% of the world’s almonds on an estimated 1.4 million acres of orchards. Isn’t that nuts?! Also, 91% of those acres are operated and owned by multigenerational family farms.

California’s family farms, large or small, remain family farms by making well-informed, day-to-day decisions on when to plant, irrigate, prune, pollinate, applicate, harvest, etc… It’s all about timing and achieving the best crop vigor/health/yield possible. Pollen System’s goal is to help perceive the best day-to-day decisions possible by harvesting data and turning it into actionable insight for farmers, and I’m looking forward to helping make that goal a reality here in the golden state of California.

Sacramento Farm


Ground Control Points for Precision Imagery

Drew Falabella, Director of Agricultural Solutions

Drew Falabella

With any form of data collection, there is uncertainty. For instance, today’s Global Positioning System (GPS) enabled smartphones are typically accurate to within a 4.9 m (16 ft.) radius under open sky. This radius matters in precision agriculture, when growers often want to consistently monitor thousands of plants week after week, year after year!

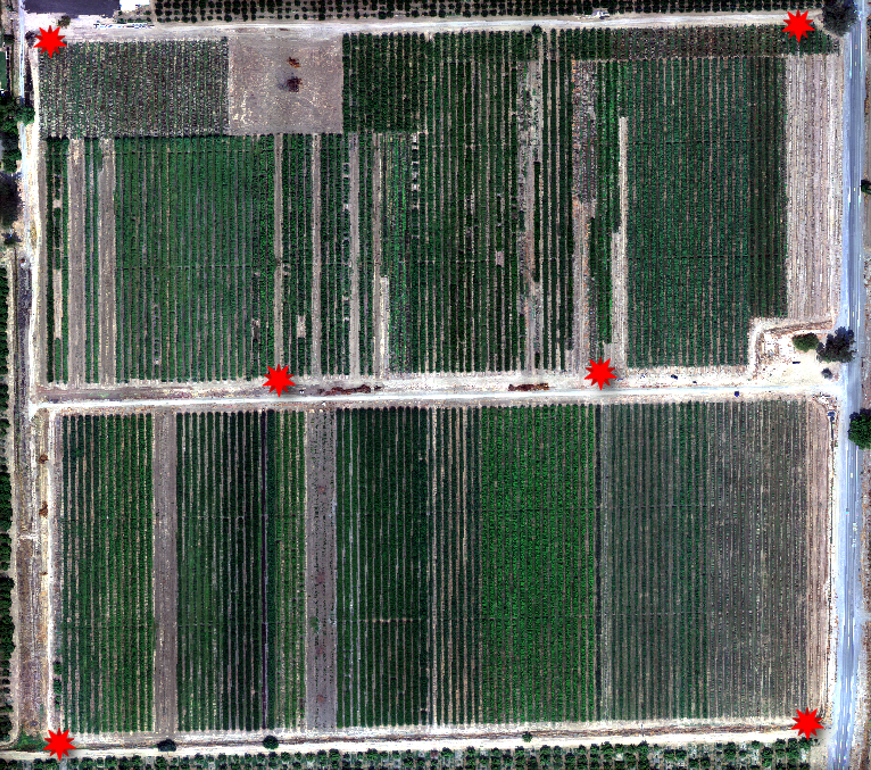
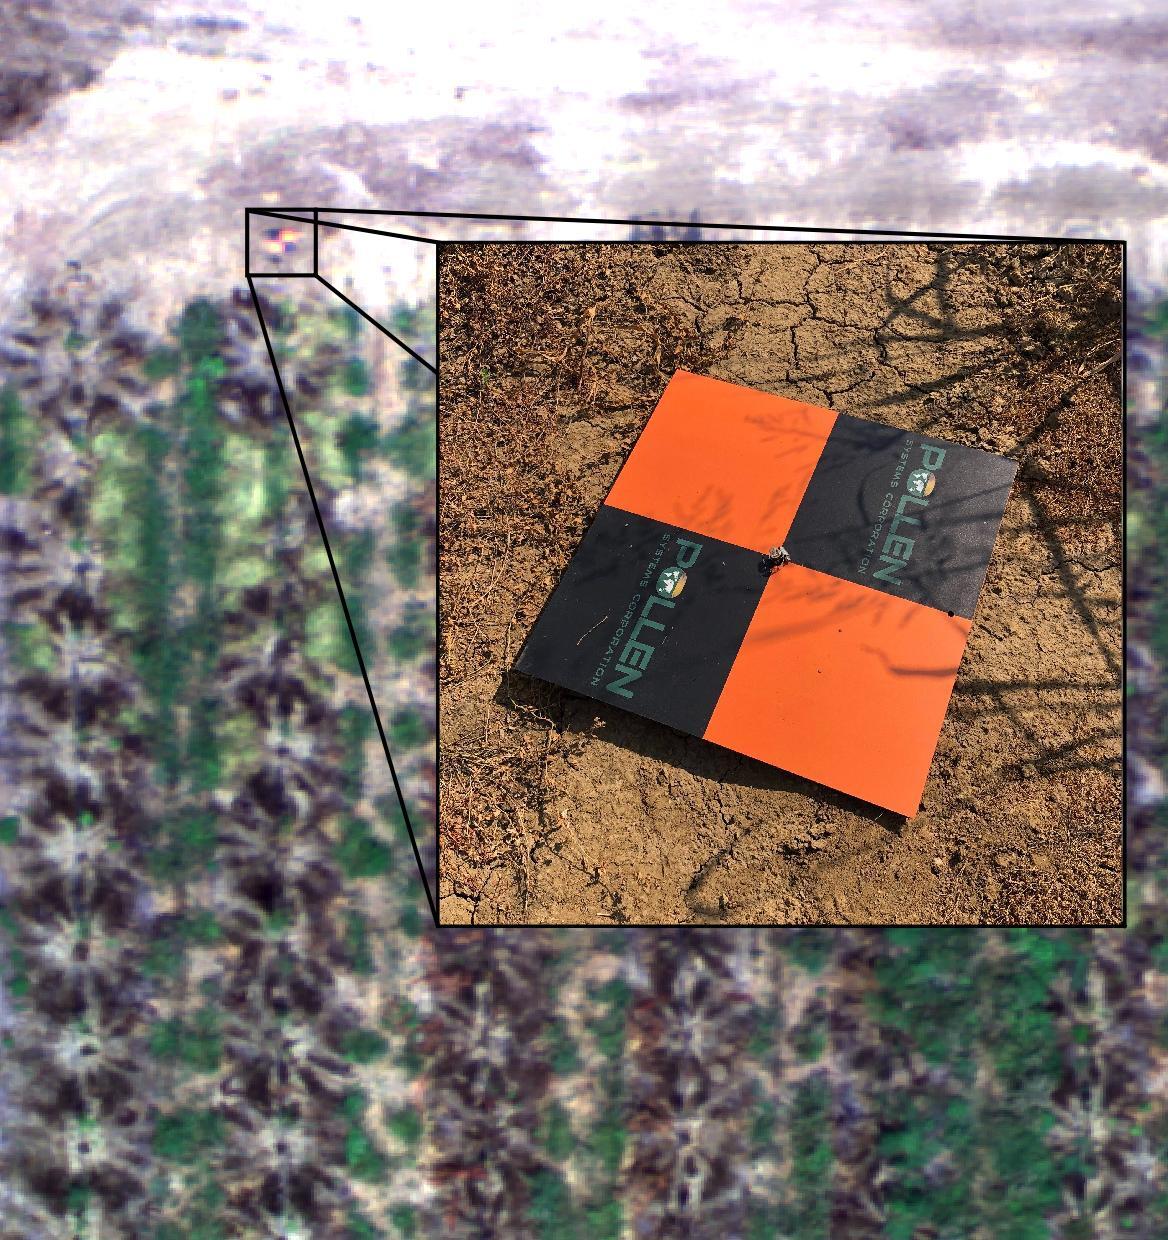
To address this issue, we at Pollen Systems turn to technology like Ground Control Points (GCPs) to achieve the highest confidence in our imagery location accuracy. Our GCPs are 2’ x 2’ aluminum plaques that are secured to the ground by a metal spike and placed to be visible from above, allowing us to align aerial images with great precision. GCPs can be geolocated down to the centimeter which enables us to track plant and tree canopy growth to centimeter accuracy.

GCP Sample Target Locations

When considering a GCP installation, the following are highly recommended:

  • Minimum of 5 GCPs, 4 placed around the perimeter of the area and 1 interior
  • No more than 1500 feet to the nearest neighboring GCP
  • Even distribution, placed to include high and low elevations
  • Placed with 360-degree clear view of the sky, minimizing obstructions and shadow

We work closely with growers to ensure the GCP locations we recommend suit their needs. Once installed, we ground-truth the center of each point with survey-grade accuracy so we can use them to consistently align images season after season.

GCP Plaque

While most often used with drone imagery, high-resolution fixed-wing imagery also yields effective (although not quite as precise) results. Such reliable location data opens the door for many useful analytics, including change detection on a per-plant level and facilitating differential harvest of specific areas within a site.

If you want to know more about Ground Control Points for your field, please drop us a line at [email protected] or call us at (888) POLLEN8. Remember to keep learning and keep growing!


Avocados in Precision Agriculture

Drew Falabella, Director of Agricultural Solutions

Drew Falabella

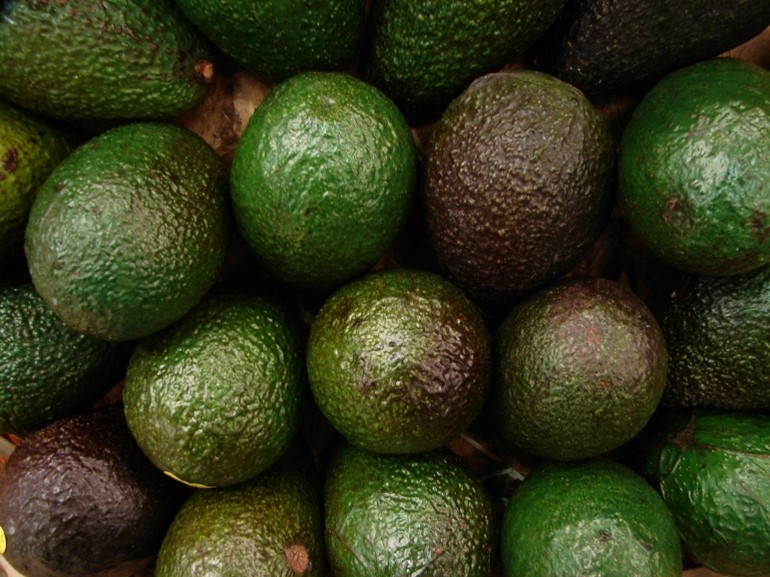
At Pollen Systems, we are always excited to apply our PrecisionView™ approach to the crops we know and love. One fruit we keep returning to at work (and in our favorite recipes) is the beloved avocado.

Adapted to rainforests by nature, avocados grow vigorously and will develop a dense canopy in a relatively short time. This growth habit is a challenge unique to cultivating avocados, as each tree also bears two overlapping years of fruit at a time: new shoots for the current year emerge even as the previous season’s mature fruit approach their harvest date.

GCP Sample Target Locations

To balance the well-being of fruit on both lower and upper branches (and optimize yield) pruning is a critical factor. With aerial imagery, it is easier to identify areas of unwanted canopy closure and adjust pruning strategies accordingly.

Some foliar disease symptoms can also become visible from the air, such as leaf yellowing or necrosis due to Persea mite or Phytopthora root rot. Additionally, irrigation issues can be identified by observing highly stressed or vigorous plants nearby.

Walking large orchards to identify this array of symptoms, especially in high avocado canopies, presents an obstacle that data-driven agricultural methods like ours can address.

GCP Plaque

Using drones or fixed-wing aircraft, entire fields can be regularly monitored to make pesticide applications, fertilizer use, and irrigation more efficient.

After each flight, a dedicated agronomist discusses our reports with you and helps to convert them into actionable insight. If you are curious about how this approach could apply to your crops, contact us at [email protected]. Remember to keep learning and keep growing!

On the Veraison: Precision Monitoring for Wine Grapes

Drew Falabella, Director of Agricultural Solutions

Drew Falabella

Wine grapes are one of the most carefully managed crops in the world, so they made the perfect starting point for Pollen Systems when we started flying in 2018. From the beginning, we have sought to help vineyard managers and winemakers obtain the data they need to cultivate high-quality grapes, leveraging the power of drones, fixed-wing aircraft, and the PrecisionView™ Manager system.

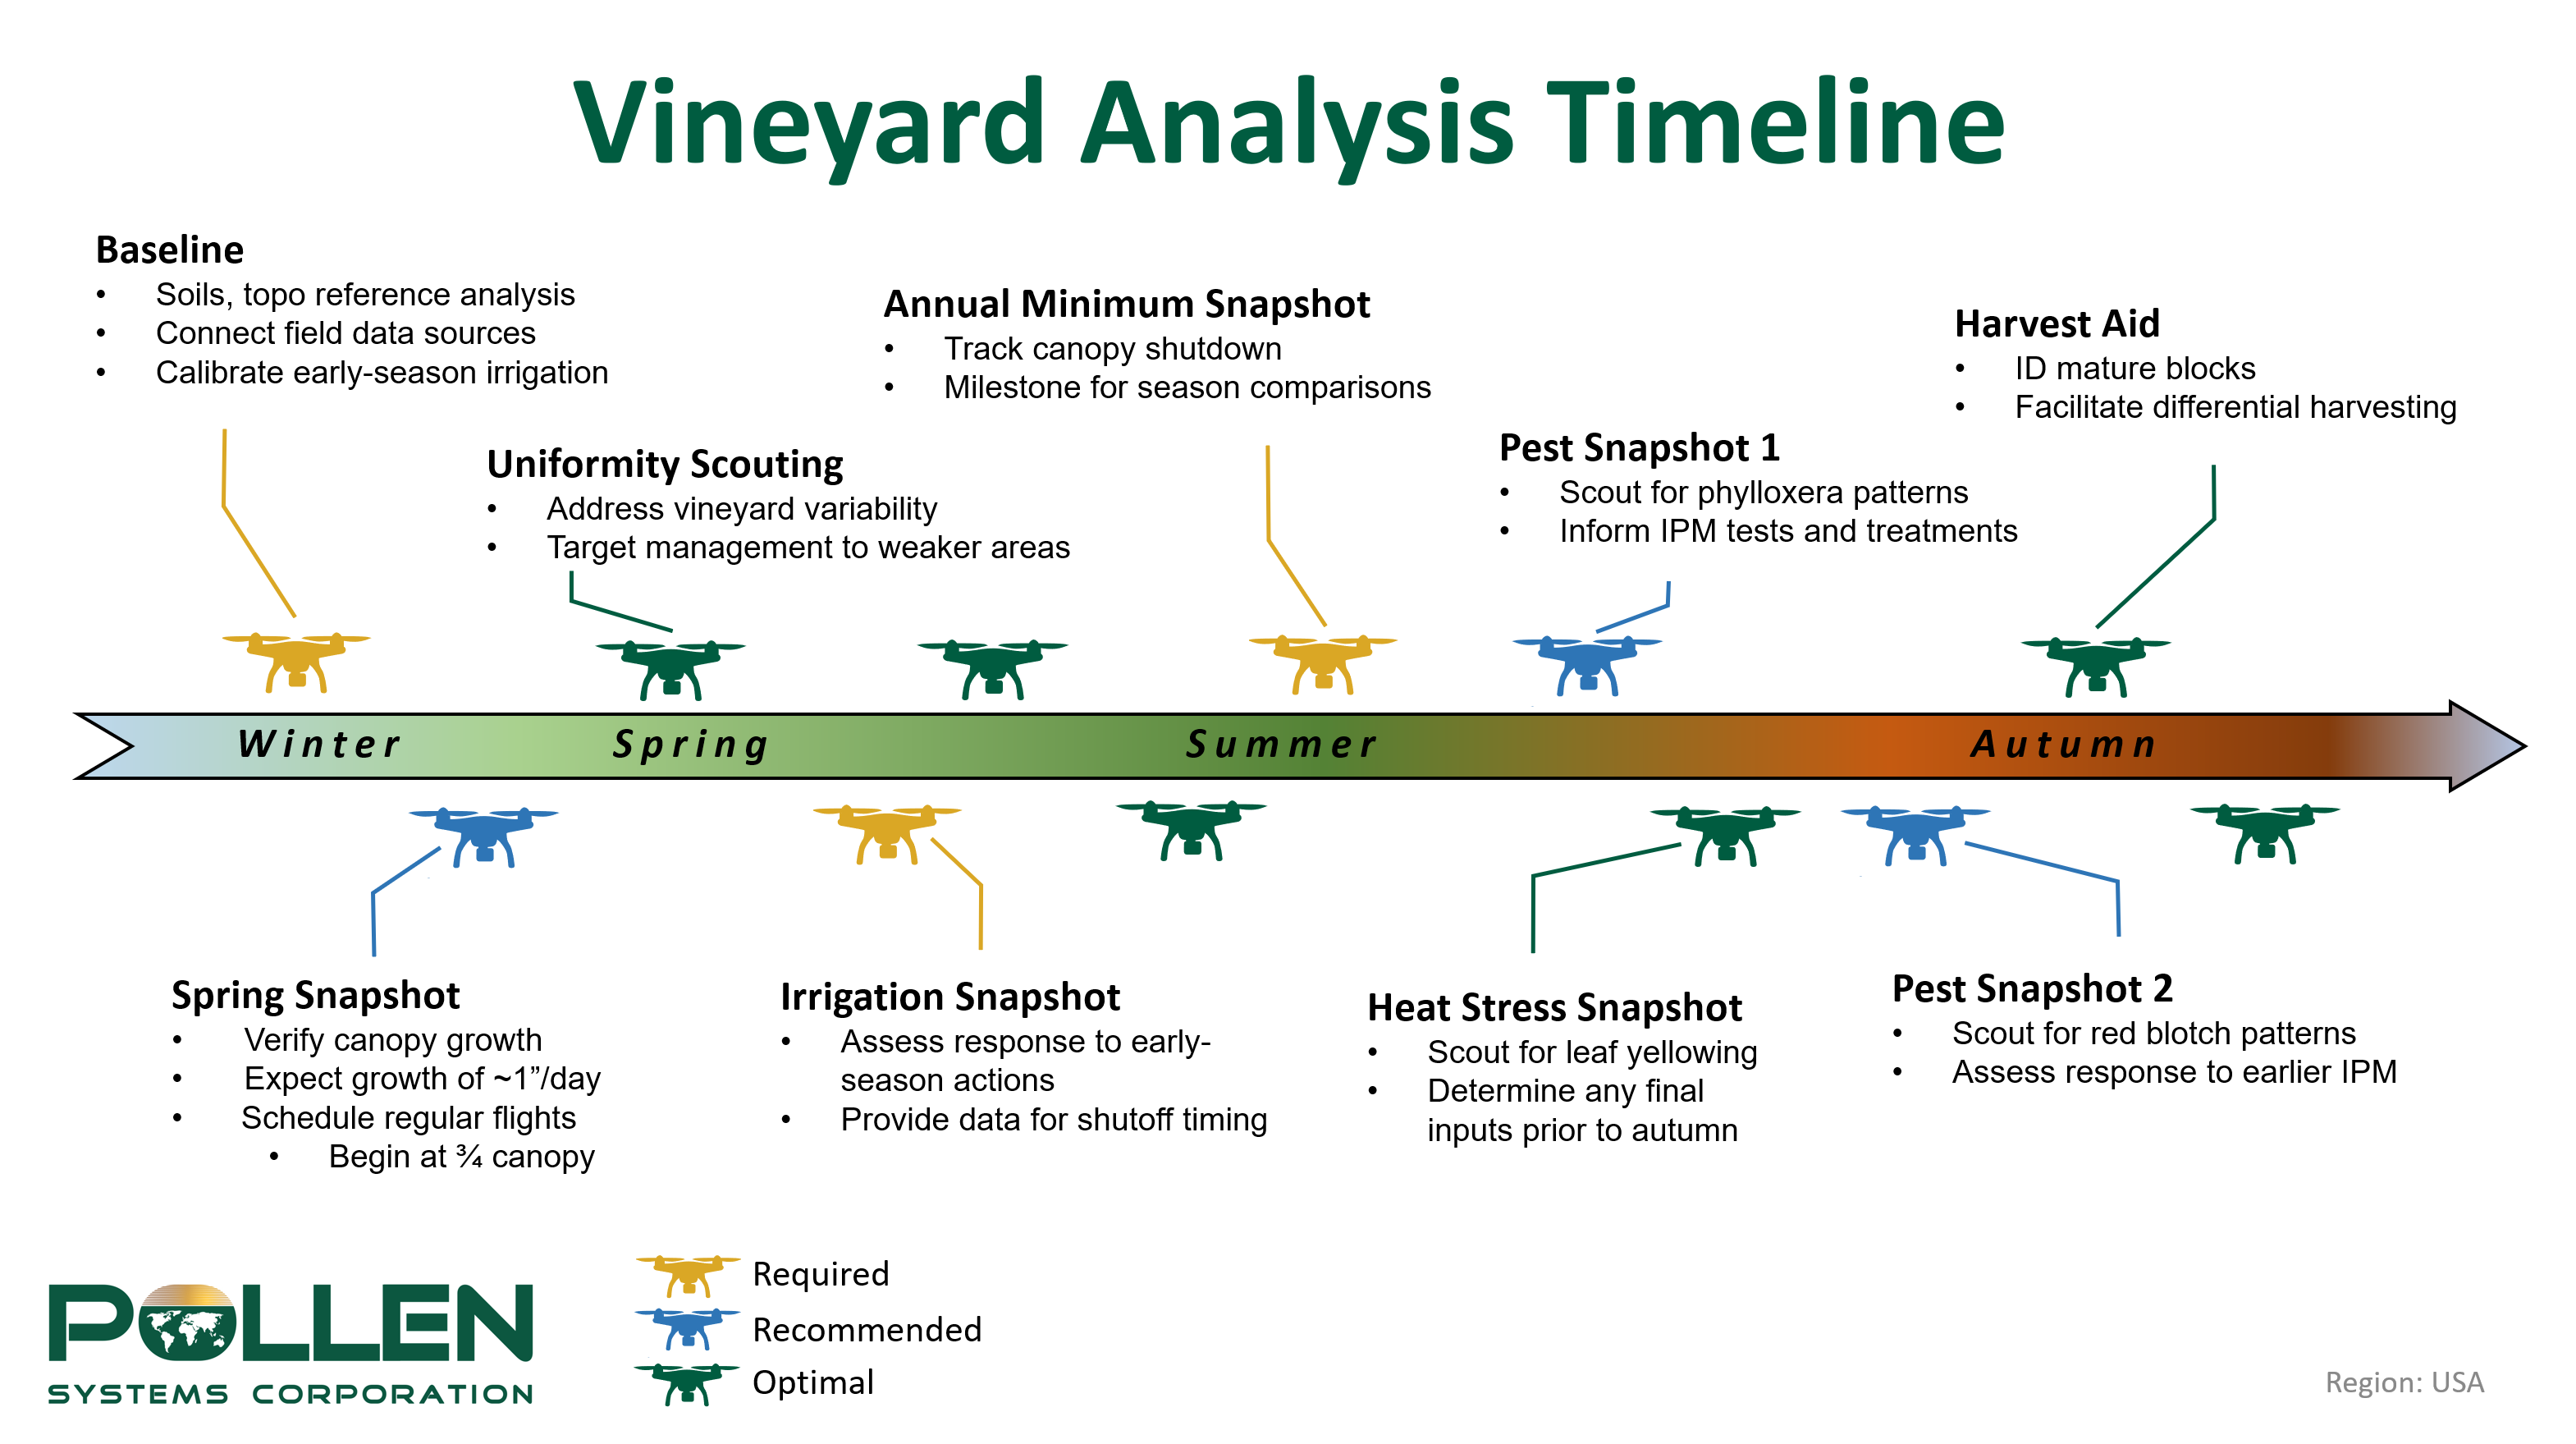
Vineyard Timeline

We approach each site with a standard vineyard monitoring plan, tailoring it to suit the grower’s needs. In the pre-season, we image the earliest shoot growth as a reference for upcoming canopy development and overlay field data like topography, soils, and moisture sensors. From here, regular flights starting at ¾ canopy allow us to monitor growth and uniformity.

Drone Flyover

In the summer, our focus shifts towards specific events. We observe plant vigor data trends early to help target the annual irrigation shutoff, capture the annual minimum vigor point in mid-summer to facilitate seasonal comparisons, and fly dedicated diagnostic flights mid- to late summer to scout for issues like heat stress and phylloxera. As autumn progresses, we scout for late-season diseases like red blotch and transition towards harvest aid efforts.

PrecisionView

Ultimately, the vineyard receives imagery, statistics, written reports, and regular calls with an agricultural technologist to convert the data into actionable insight. PrecisionView™ Manager then allows the grower to view and collect more vineyard data in the field or the office. If this sounds interesting to you, please reach out to us at [email protected]. We are proud to keep learning and growing with the wine industry, and look forward to continuing our journey with you!

A Fresh Take on Precision Agriculture in Citrus

Drew Falabella, Director of Agricultural Solutions

Drew Falabella

As technology has developed, it has become clear that advanced agricultural analytics can optimize crop quality and yield for bigger, better harvests in the field and at the bank. With the value of citrus fruit like oranges and mandarins on the rise, Pollen Systems is helping growers get the most out of these crops with a specialized drone monitoring plan customizable for winter and summer varieties.

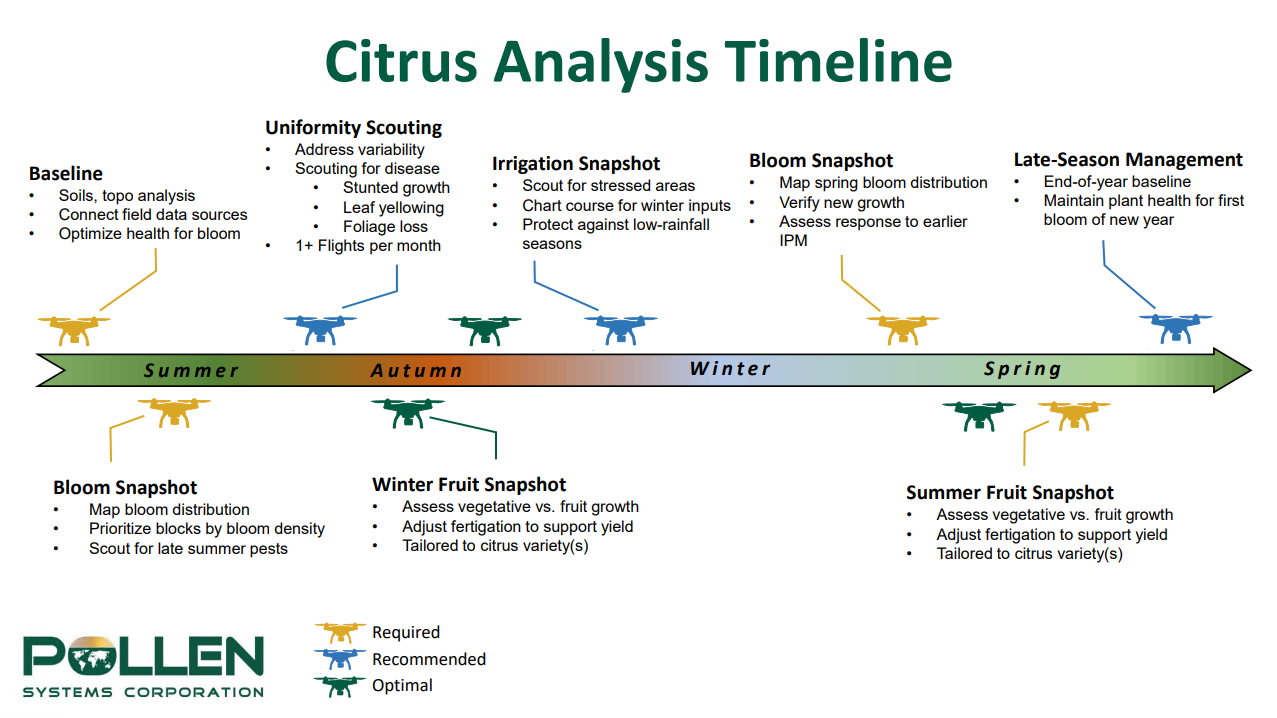
Citrus Timeline

Our first two flights are most essential for citrus, establishing a preseason baseline of plant vigor using our multispectral cameras and targeting management to ensure a healthy flowering period before ripening. One or more flights per month during growth and ripening are recommended to address variability and locate symptoms of various pests and disease, such as crown rot or citrus greening. Optimally, irrigation and fruit snapshots allow timely fertigation to support a bountiful yield and robust health through the winter months.

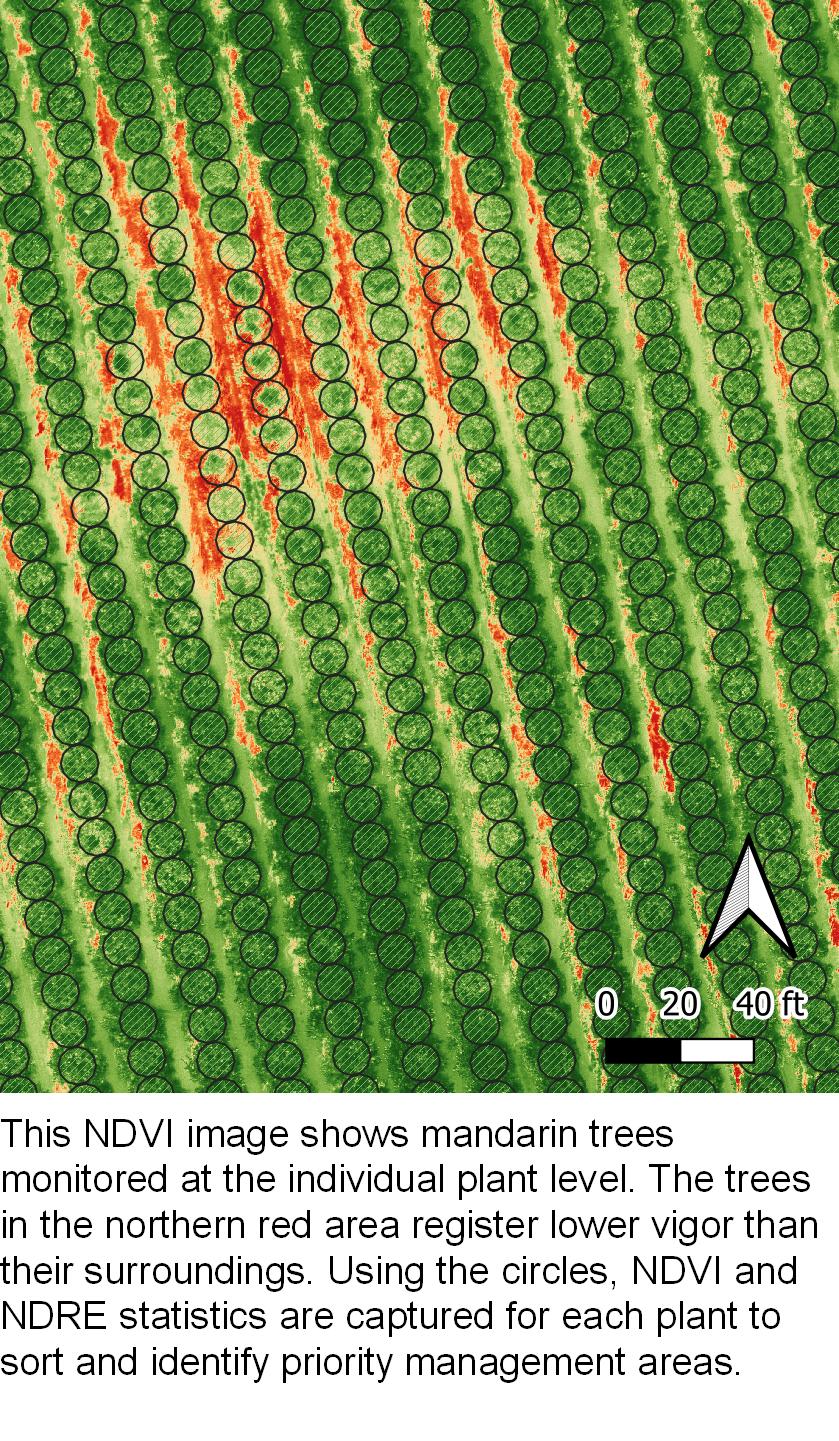
Citrus NDVI

Flights return in spring to monitor new growth. For some crops, a second round of bloom and fruit snapshots guide a second harvest, while they supply essential pest monitoring and uniformity scouting data for the rest. The final flight of the season captures a landmark to be compared year after year and ensures that crops are on the right track for spring and summer.

Ultimately, we value the expertise our customers bring to the table, implementing collaborative solutions tailored for each grower’s needs. If this got your creative juices started on ideas for your own fields, reach out to us to learn more. We are happy to detail our offerings and draft a customized monitoring plan with you!

Pollen Systems Named 2021 Top Seattle Agricultural Data Technology Startup

Benzinga

Benzinga names Pollen Systems a 2021 Seattle Best Technology Startup

Agriculture and technology may seem like an odd pair, but it’s a pairing that makes a lot of sense (and cents) when you think about it. Pollen Systems offers robots and drones that collect and analyze agricultural data and help farmers “optimize crop yields, vitality and evenness”.

Pollen Systems helps farmers increase their profits by using accurate data on harvest performance, allowing them to analyze growth problems. This allows growers to have more control over their crops and, as a result, have a more abundant yield.

Read more

RTK and NTRIP "Level Up Accuracy" at Pollen Systems

Drew Falabella, Director of Agricultural Solutions

Drew Falabella

As anyone who has navigated by their phone knows, standalone GPS can be inaccurate to tens of feet. In order to measure individual plant growth in a crop, we needed to improve both our capture mechanisms and our analytics to filter out ground cover and other obstacles from the data required to collect accurate sample data on each and every flight.

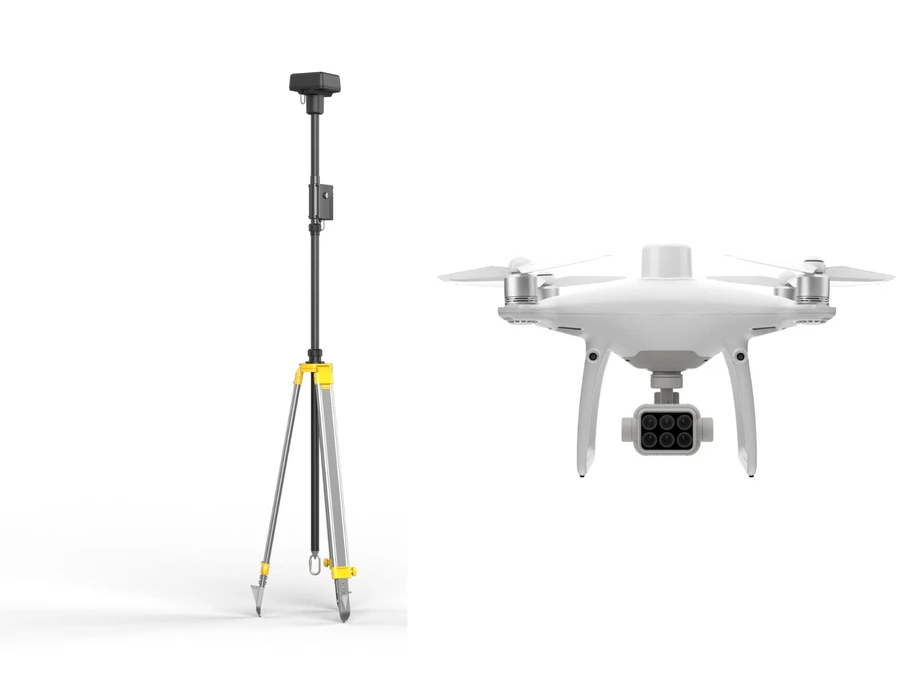
At Pollen Systems, we aim to collect data that is ever more accurate than could be obtained with previous generations of technology. We have invested in natively supporting Real-Time Kinematic (RTK) positioning for our aerial imagery as the next step onward and upward! RTK supersedes the GPS receiver present in most drones by reaching centimeter-level accuracy without the need for Ground Control Point (GCP) installations or lengthy surveys.

DJI Multispectral with RTK Mobile Station

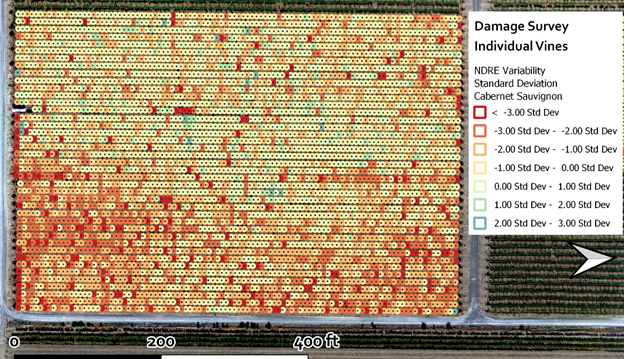
While typical GPS receivers rely solely on a satellite network for their positioning data, RTK systems add a local base station to the mix. Both the base station and the RTK rover connect to a network of positioning satellites, but they also connect to each other, validating the data collected by each party and calculating the drone position in real-time. This reduces the positioning error by up to 98% compared to standalone GPS, allowing us to generate precision analytics such as the damage survey below without installing any GCPs in the field.

Damage Survey Individual Vines

Adding to all these benefits, RTK is compatible with two base station types, from survey-grade antennas planted onsite to NTRIP caster stations operated by local institutions. While antennas are best for our most remote service areas, NTRIP casters offer an accessible path to RTK accuracy in more developed regions. With these tools available, Pollen Systems can deploy centimeter-accurate data solutions to more fields than ever. If you are curious about how our technology can deliver the precision insights you need, reach out to us at [email protected] to schedule a call with our team!

Empowering Farm Management through Individual Plant Analysis

Drew Falabella, Director of Agricultural Solutions

Drew Falabella

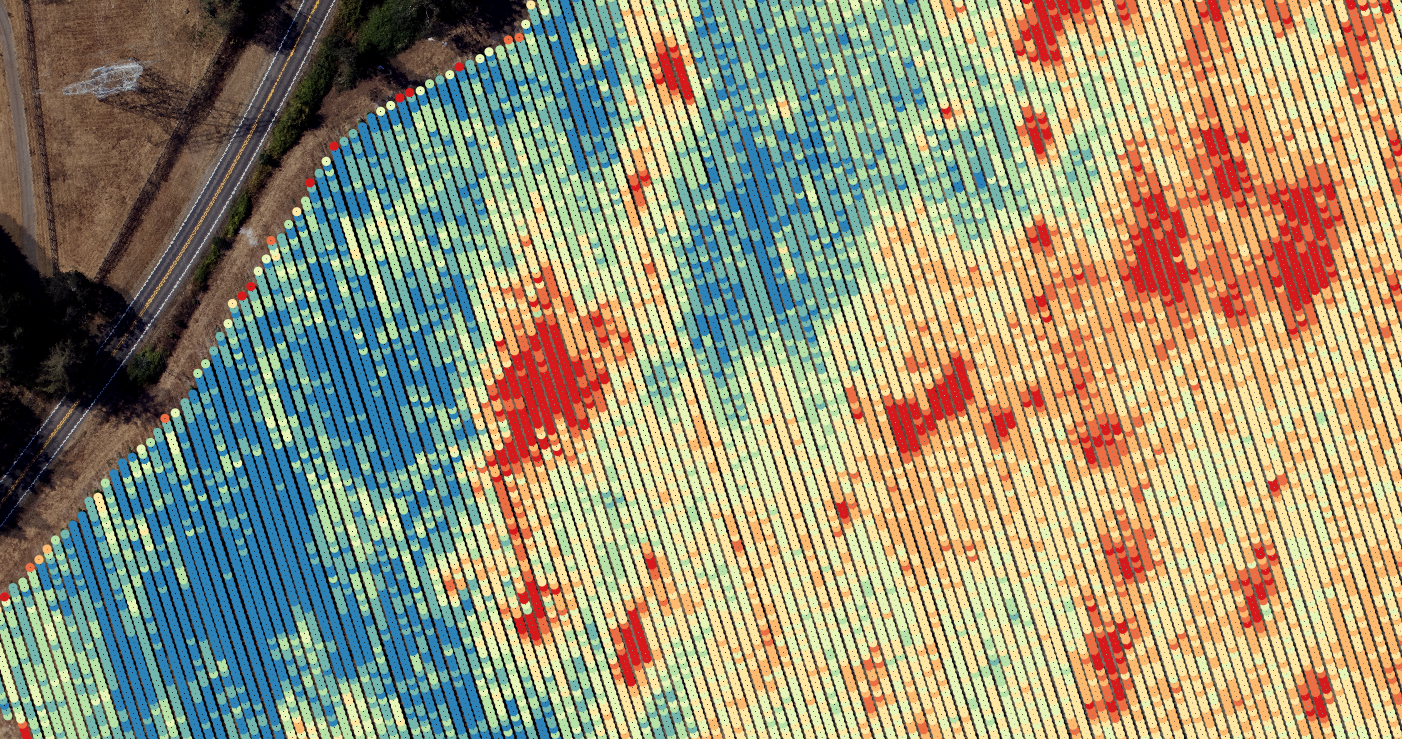
Individual Plant Analysis is at the forefront of precision agriculture for a reason: it provides the most detailed data layer possible and improves decision-making for an entire field. Today, Pollen Systems' Advanced Agricultural Analytics serve growers in three major ways.

Optimizing Harvest: Mapping our vigor metrics like NDVI, NDRE, and thermal across a site highlights nutrient deficiencies, pests, and water stress that can be roadblocks to the perfect harvest. Impacts to Crop yield and uniformity are major concerns for large- and small-scale growers alike, and our reports empower timely, targeted management to support weaker areas.

PrecisionView Report Per Plant

Change Detection: While frequent gound monitoring can be labor-intensive, drone monitoring of our individual plant framework provides whole-field data comparison with every flight. Assess data captured before and after thinning, fertilizer applications, or irrigation changes to measure the outcome and guide further management. Set flights every week to quickly identify problems and verify once they are solved.

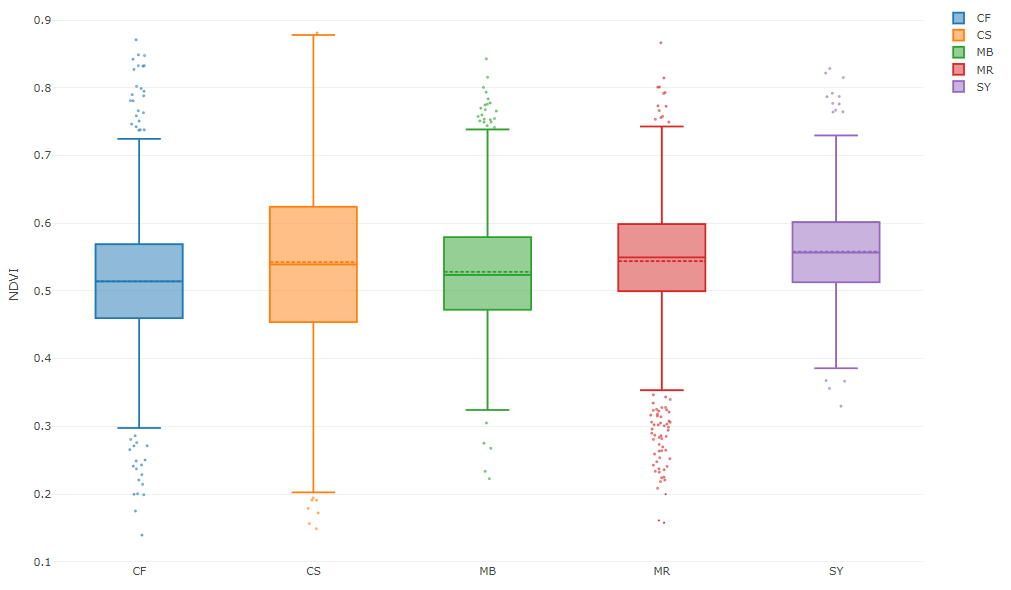
Enhanced Field Research: Instead of relying solely on random samples to understand a trial, drone imagery provides multispectral and thermal data for every plant in the field. Sort the data by plant treatment, plot number, or filter by multiple categories to address each experimental hypothesis with our PrecisionView™ Manager platform. Share the data-driven story behind each trial to make an impact in the field and the boardroom.

Advanced Vigor Chart Detail Variety

When PrecisionView™ Manager analyzes individual plants, your insights become even more powerful. Updated online within 48 hours of a flight, our in-depth statistics on crop stress, canopy growth, and irrigation status can be leveraged to produce ideal results. Tell us about your goals at [email protected], and let’s explore what we can grow together.

Understanding Near-Infrared Imagery in Precision Agriculture

Drew Falabella, Director of Agricultural Solutions

Drew Falabella

Near-Infrared (NIR) imaging has been assisting scientists and growers for decades, providing a technological lens to examine crops. Most famously used on orbital satellites for environmental observations, NIR imaging has developed into highly portable and powerful technology used by commercial growers around the world.

But how does Near-Infrared imaging help growers effectively protect their fields against today’s challenges?
Drone with Near-Infrared Sensors

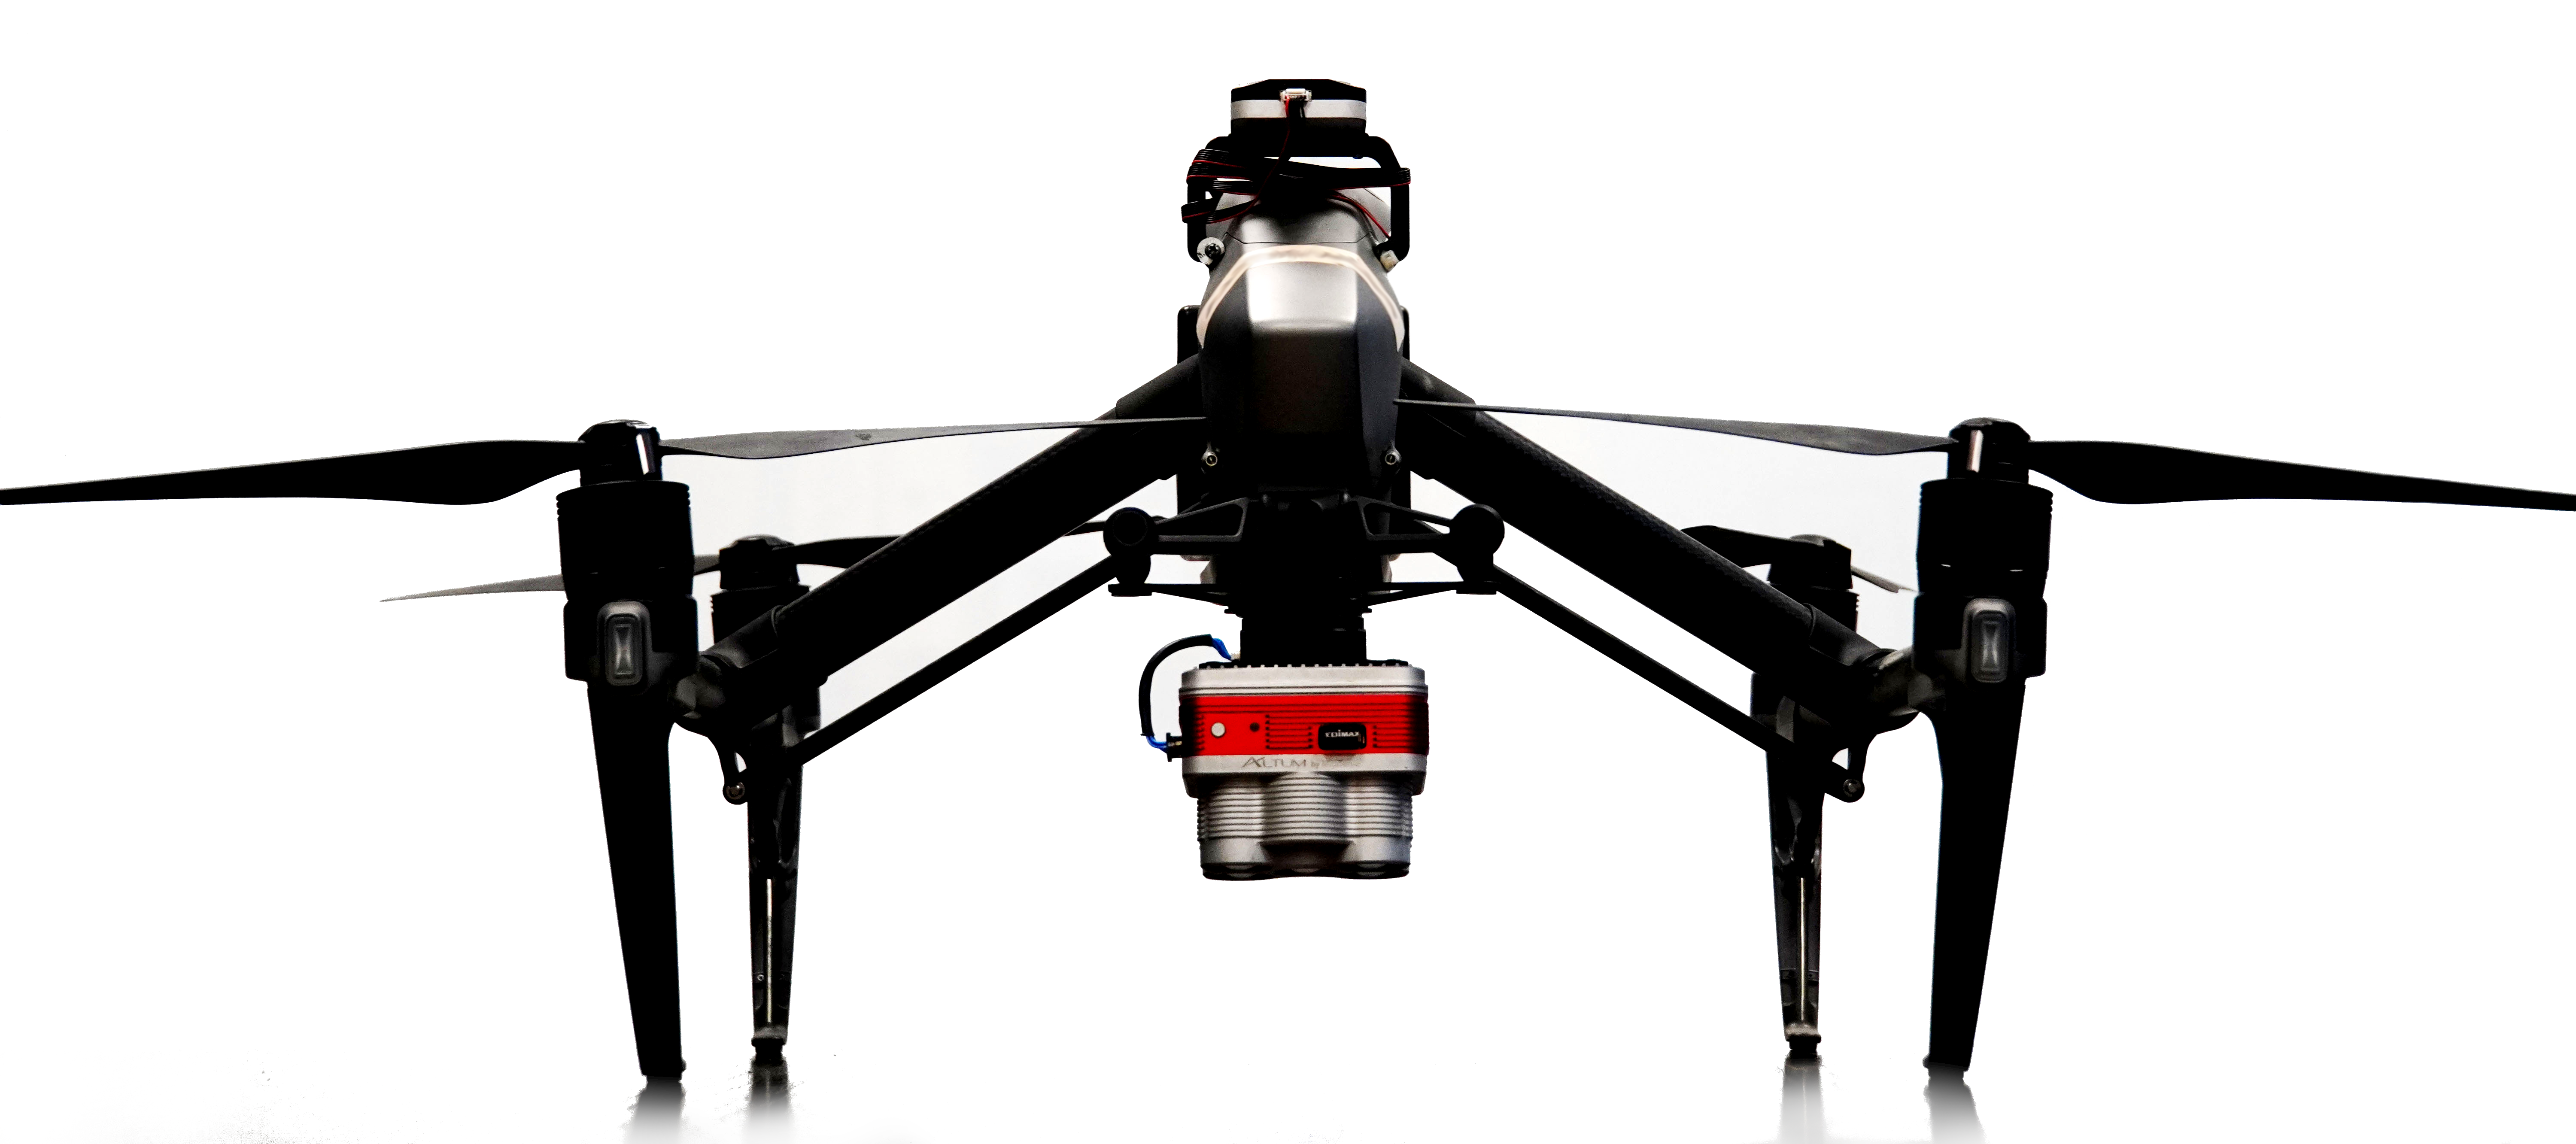
In modern precision agriculture, specialized drones carry cameras targeting specific wavelengths of light. While chlorophyll pigments strongly absorb visible red (600-700nm) wavelengths, they are more reflective in the Red Edge wavelengths (680-730nm) and highly reflective in the Near-Infrared wavelengths (700-1300nm). Based on the proportions of each wavelength reflected by the plant, chlorophyll content can be detected and translated as an NDVI index value:

NDVI = (NIR reflectance – Red reflectance) / (NIR reflectance + Red reflectance)

In vigorous foliage, the amount of red light reflected will be low, and NIR light reflected from the chlorophyll will be high, resulting in higher NDVI values approaching 1. If the foliage is stressed, it will likely have less chlorophyll and more dead tissue, leading to a paler color that reflects more red and less NIR to yield lower NDVI values approaching 0.

Using Red Edge instead of Red in the equation produces an NDRE value instead:

NDRE = (NIR reflectance – Red Edge reflectance) / (NIR reflectance + Red Edge reflectance)

NDRE is more sensitive to small variations in dense canopy, but is normally lower than NDVI measurements of the same crop, since plants usually reflect Red Edge light more strongly than visible red light.

Because they are tied to chlorophyll content, NDVI and NDRE can be used to detect many negative crop conditions. Water deficiency can lead to canopy shutdown and decreased chlorophyll.

Vineyards in Washington use NDVI and NDRE to plan the duration of their summer irrigation shutoff, monitoring canopy vigor week by week to pilot vines into the all-important veraison stage.

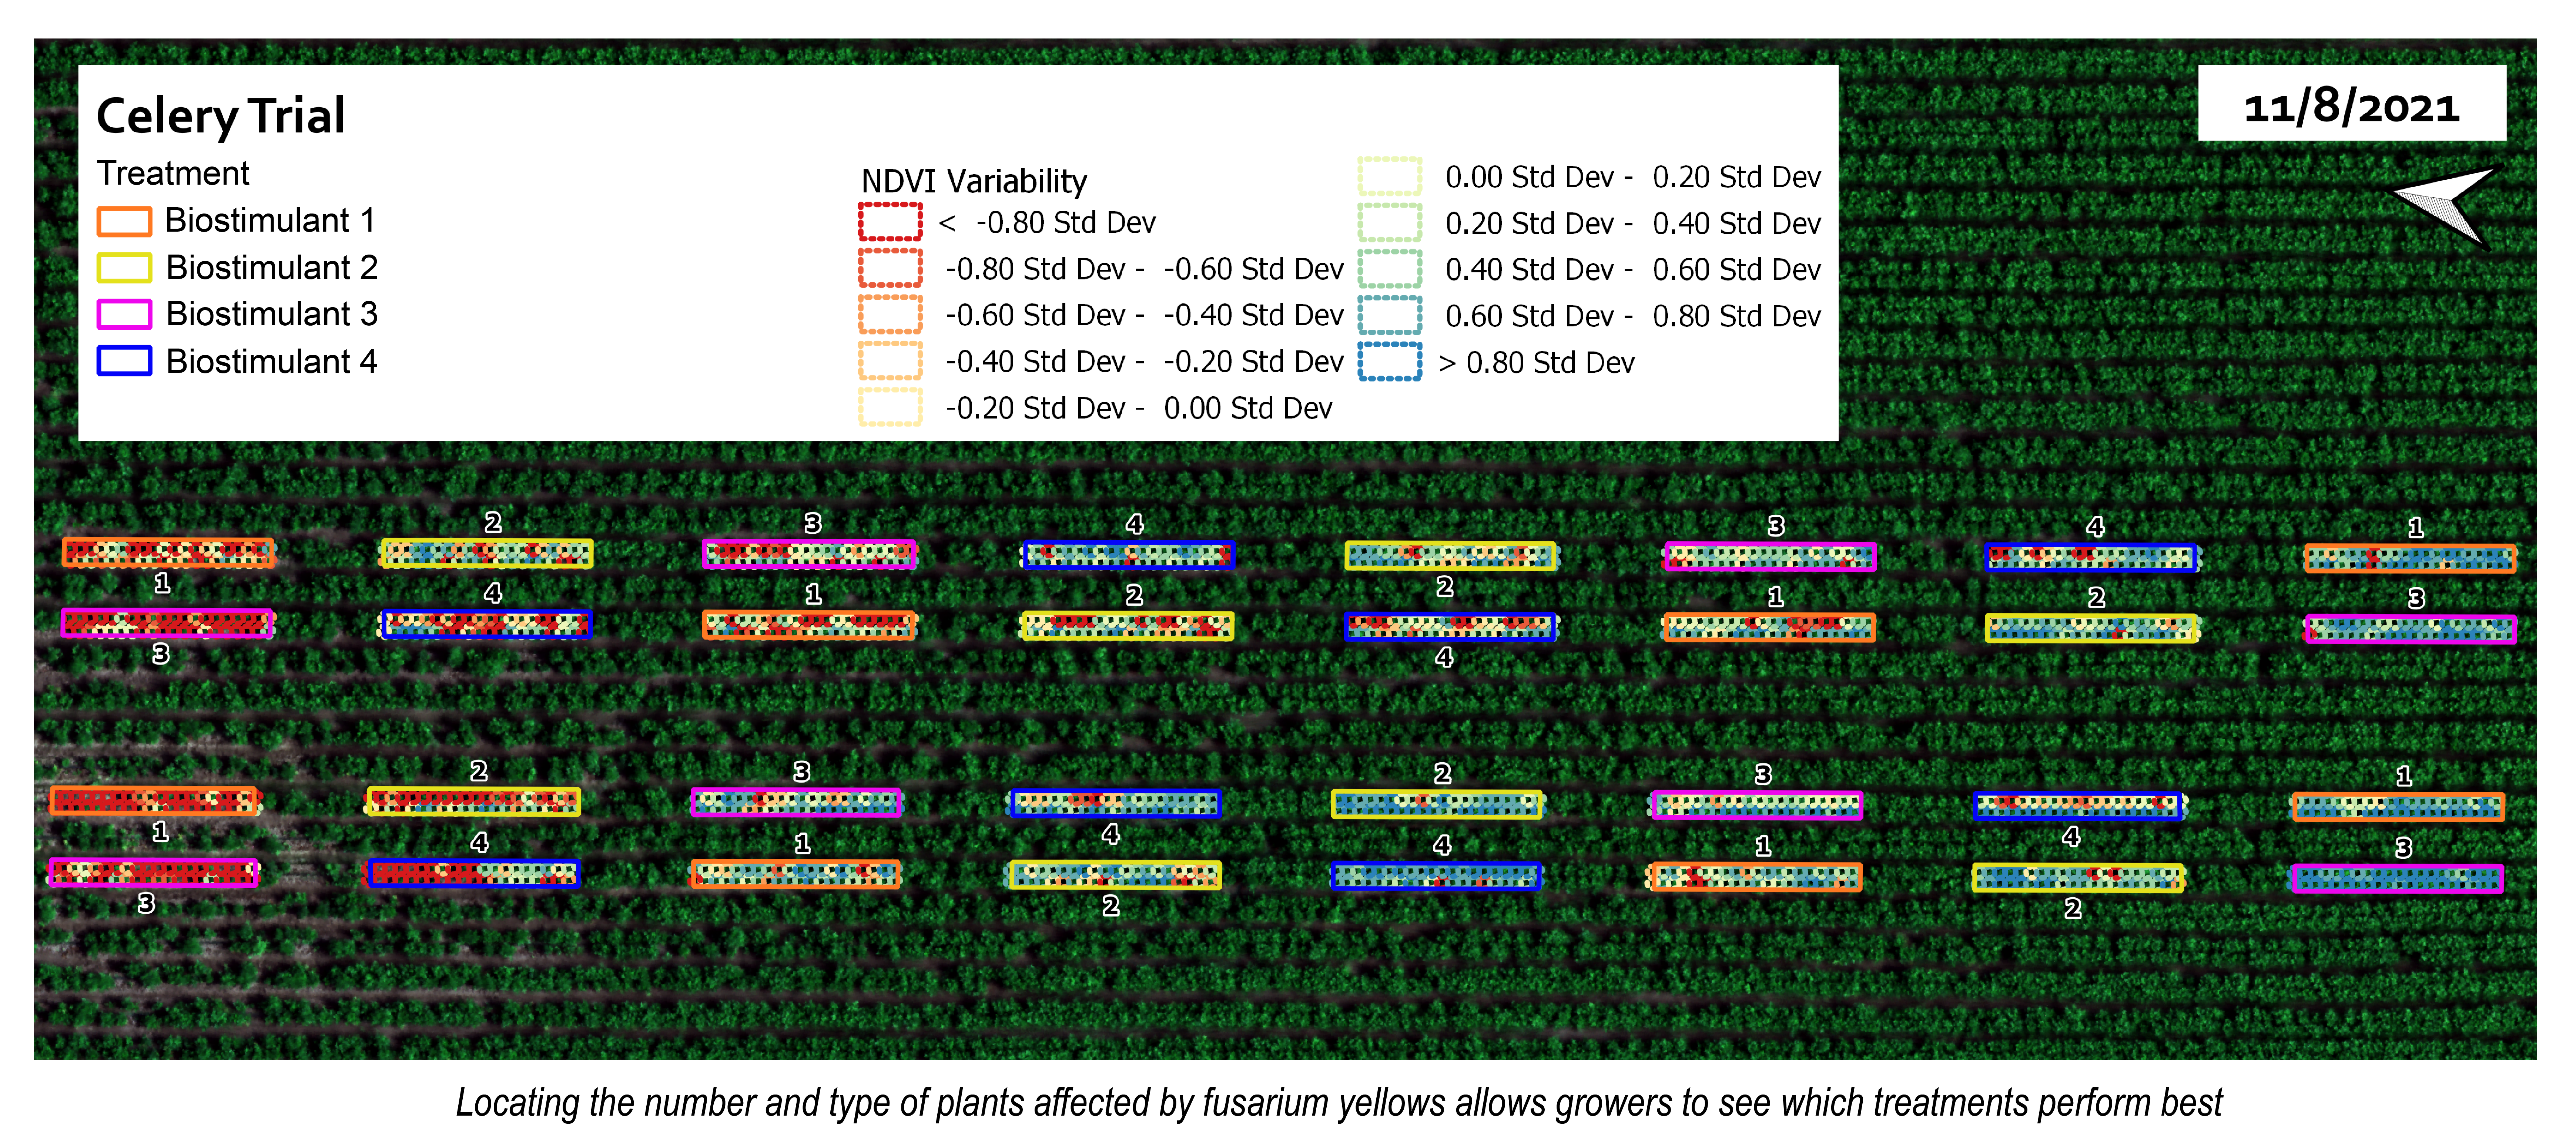
Depending on the crop, nutrient deficiencies lead to chlorophyll loss detectable through NIR imagery. In bananas, potassium or magnesium deficiency can cause yellow banding or necrosis. Pest and disease can also induce foliar stress in certain crops, with fusarium yellows in celery shown on the left side of the image below. In this individual plant analysis, the crops in red circles are most heavily afflicted.
Phylloxera Monitoring

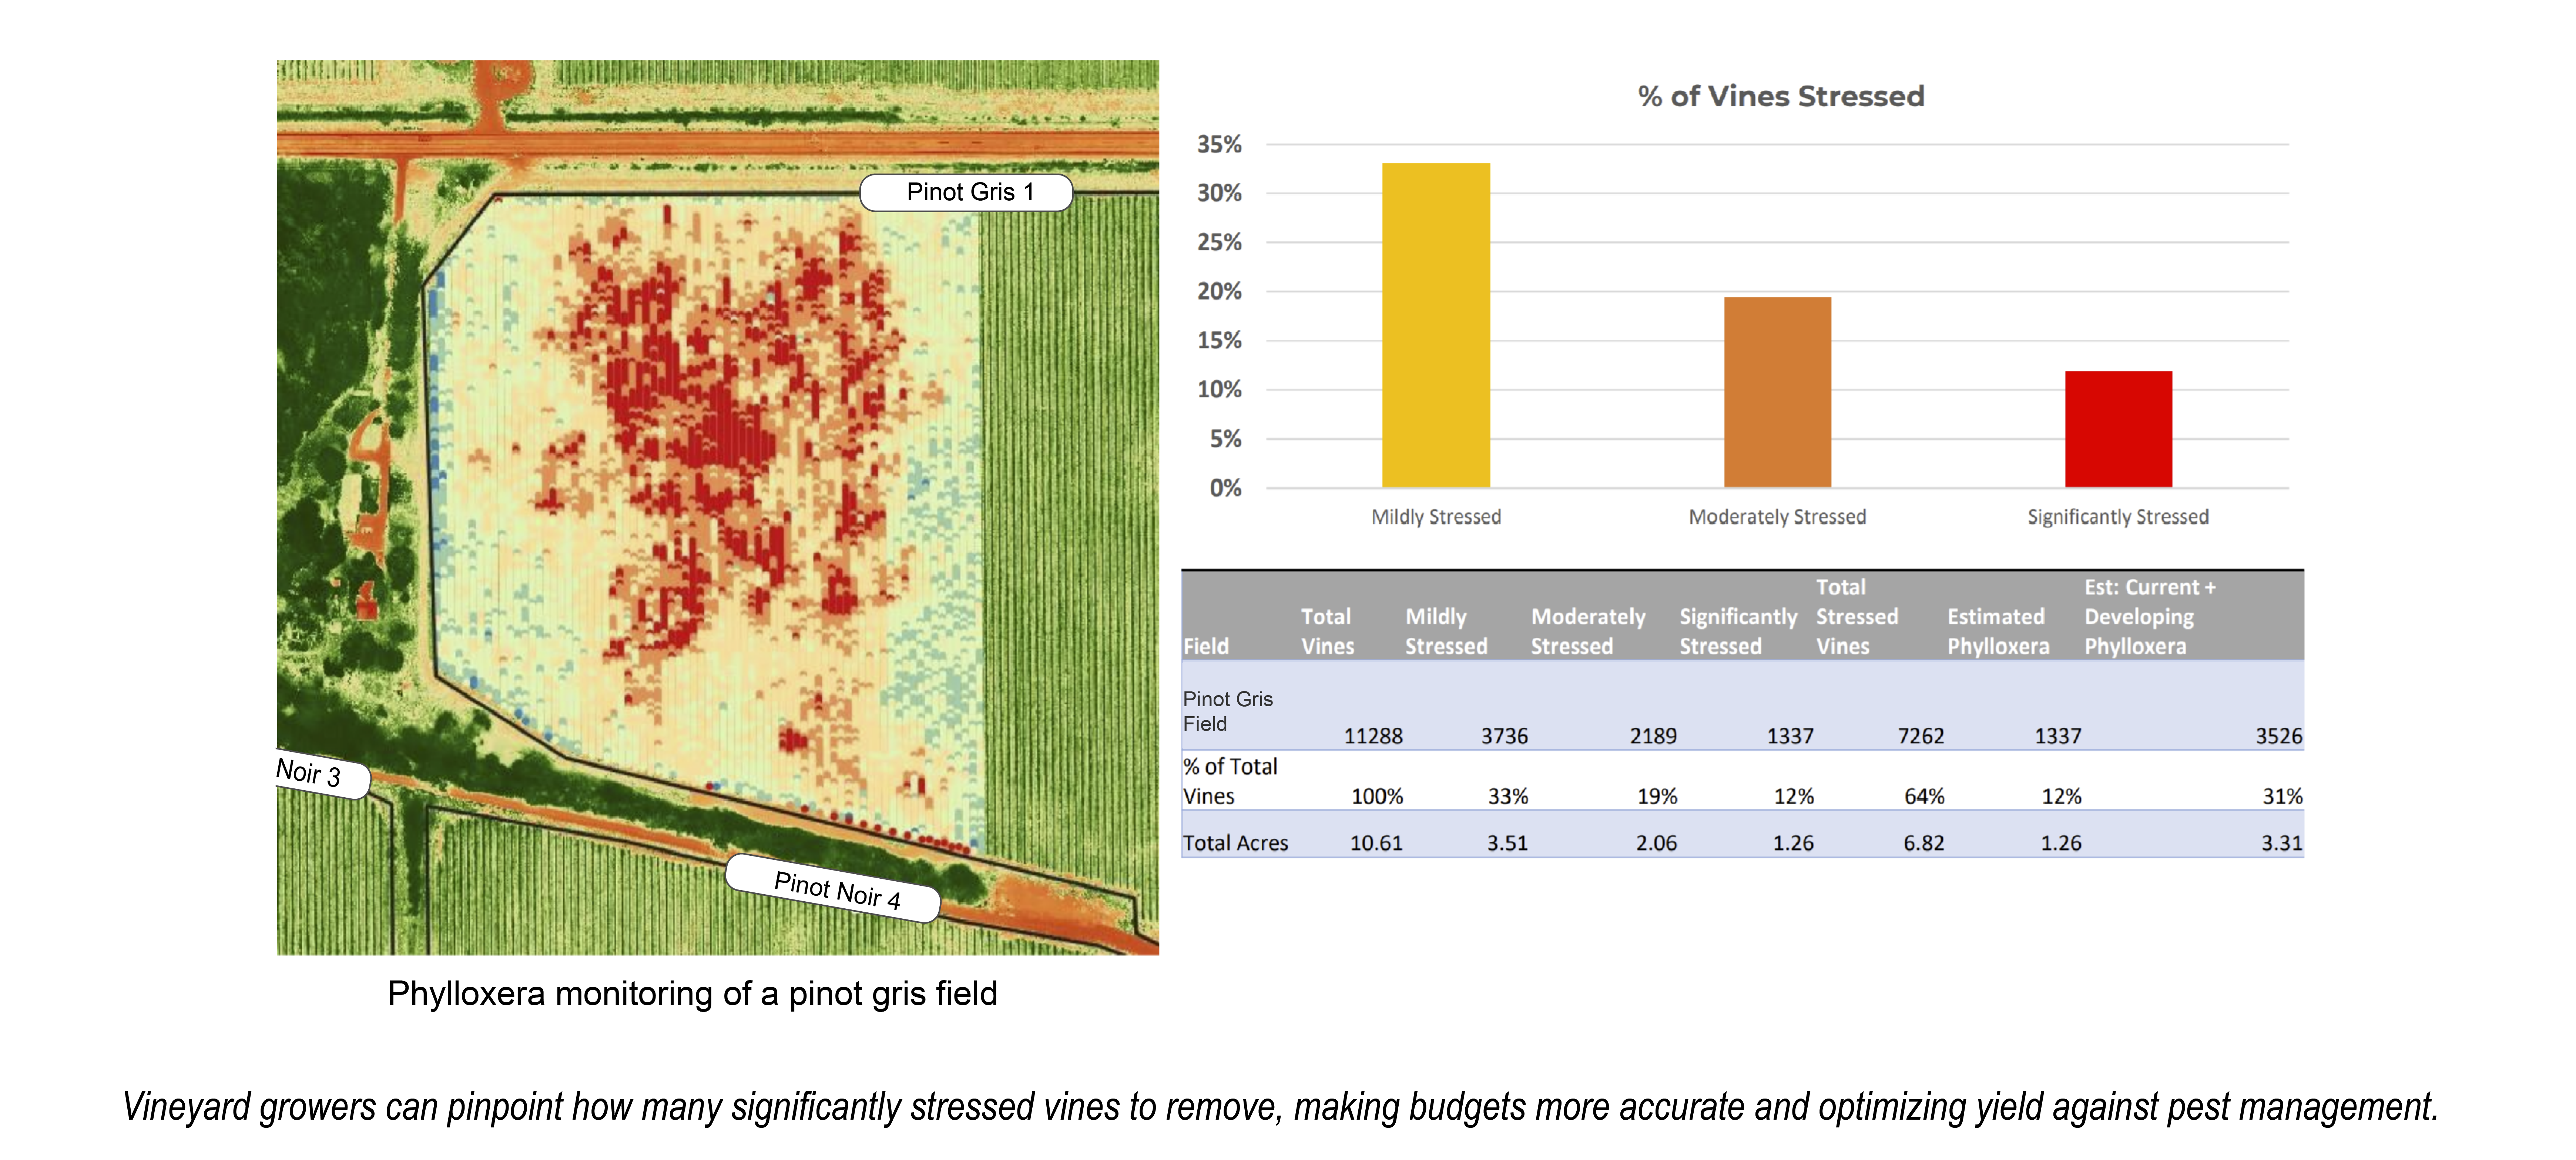
Today, Pollen Systems leverages NIR imaging in Advanced Agricultural Analytics for growers in the US, Mexico, and Chile. Combined with our individual plant analysis and environmental data collected by drone and other technologies, NIR data products like NDVI and NDRE can be used to calculate the locations and number of acres suffering from stress. By referring to our crop-specific analysis timelines and comparing all data layers, we can make observations and suggest management actions tailored to the specific field.

This is especially useful in vineyard management, where a careful balance of managing for yield, quality, and pest control. Sometimes, replanting vines is the best way to reduce the impact of disease, but doing so sacrifices any remaining yield that could have been obtained by nursing vines through a few more seasons.

Clients have used our system to identify severe phylloxera symptoms in their vines and remove the ones that were not worth nursing. Because they receive specific numbers of plants affected in each area, they can budget their replanting costs months before removing the old vines and clearly justify that cost to stakeholders.
Stressed Plant Analysis

This is just one way that growers have gained valuable insight through the Near-Infrared imaging technology we provide. With the power of PrecisionView Manager™ behind it, drone imaging produces more than pretty pictures – it generates a library of data that growers can leverage season after season.

To learn more about our advanced agricultural analytics and how we can serve you, reach out to us at [email protected]!
Per-Pixel Analysis to Detect Almond Bloom

Drew Falabella, Director of Agricultural Solutions

Drew Falabella

In pursuit of the most accurate yield prediction methods, growers often look to early indicators of fruit set, such as bloom density, to provide insights. This is usually a lengthy, labor-intensive, and error-prone process with a narrow bloom window during which data can be collected. With multispectral imaging, targeted drone data captures, and advanced pixel-level analytics, Pollen Systems is making bloom detection faster and more consistent on a per-plant basis to help growers improve their yield prediction results.

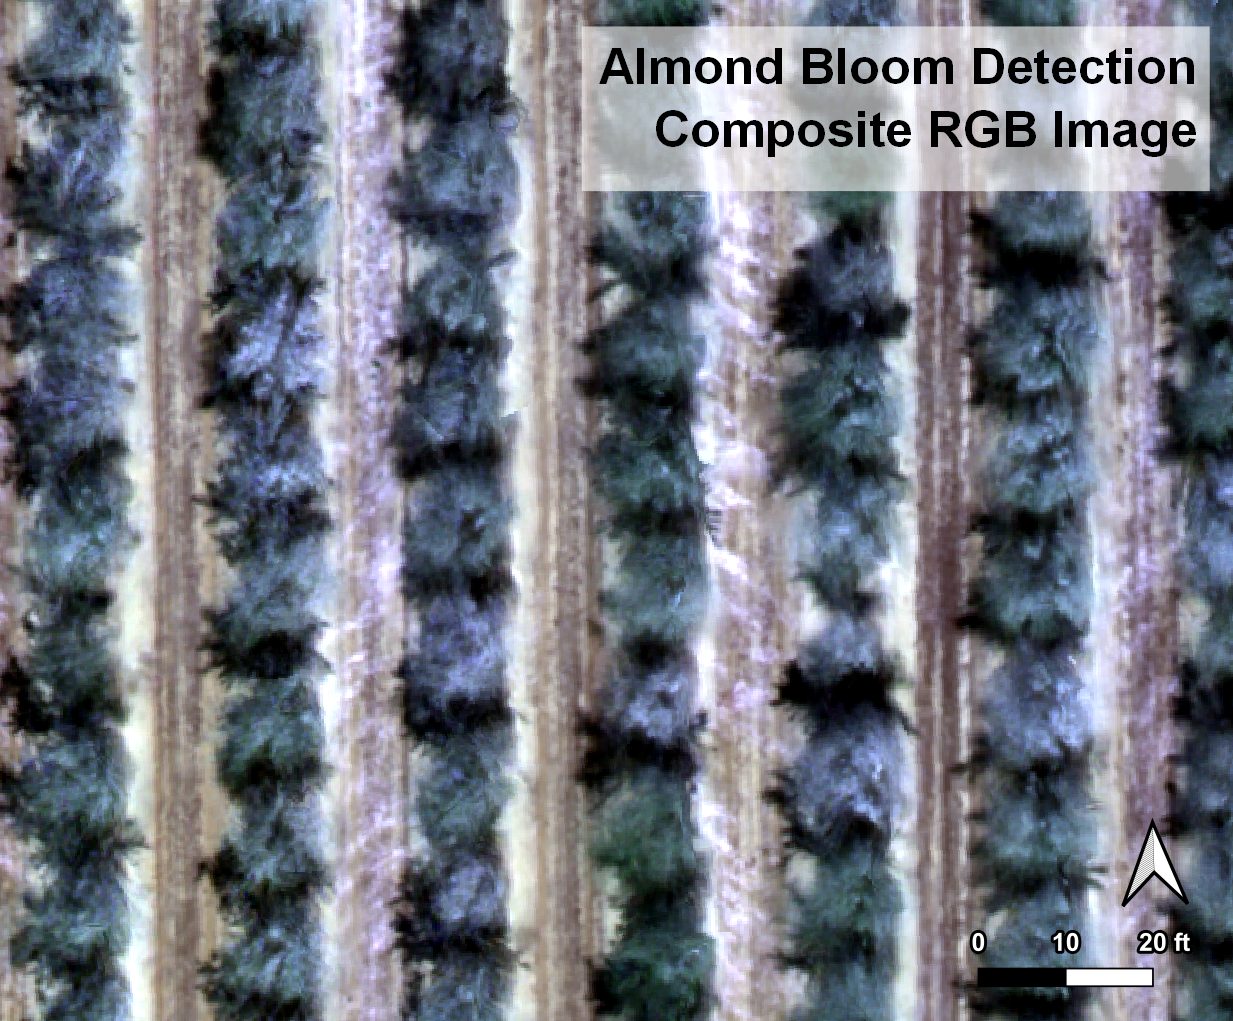
In a nutshell, the analysis uses the color characteristics of almond blooms to target specific pixels in our imagery and calculate the exposed bloom surface area. For example, the ratio between the red and green light reflectance from an almond bloom stays relatively consistent when viewed from above and can be used to select pixels that contain blooms.

Bloom Sample Close with RGB

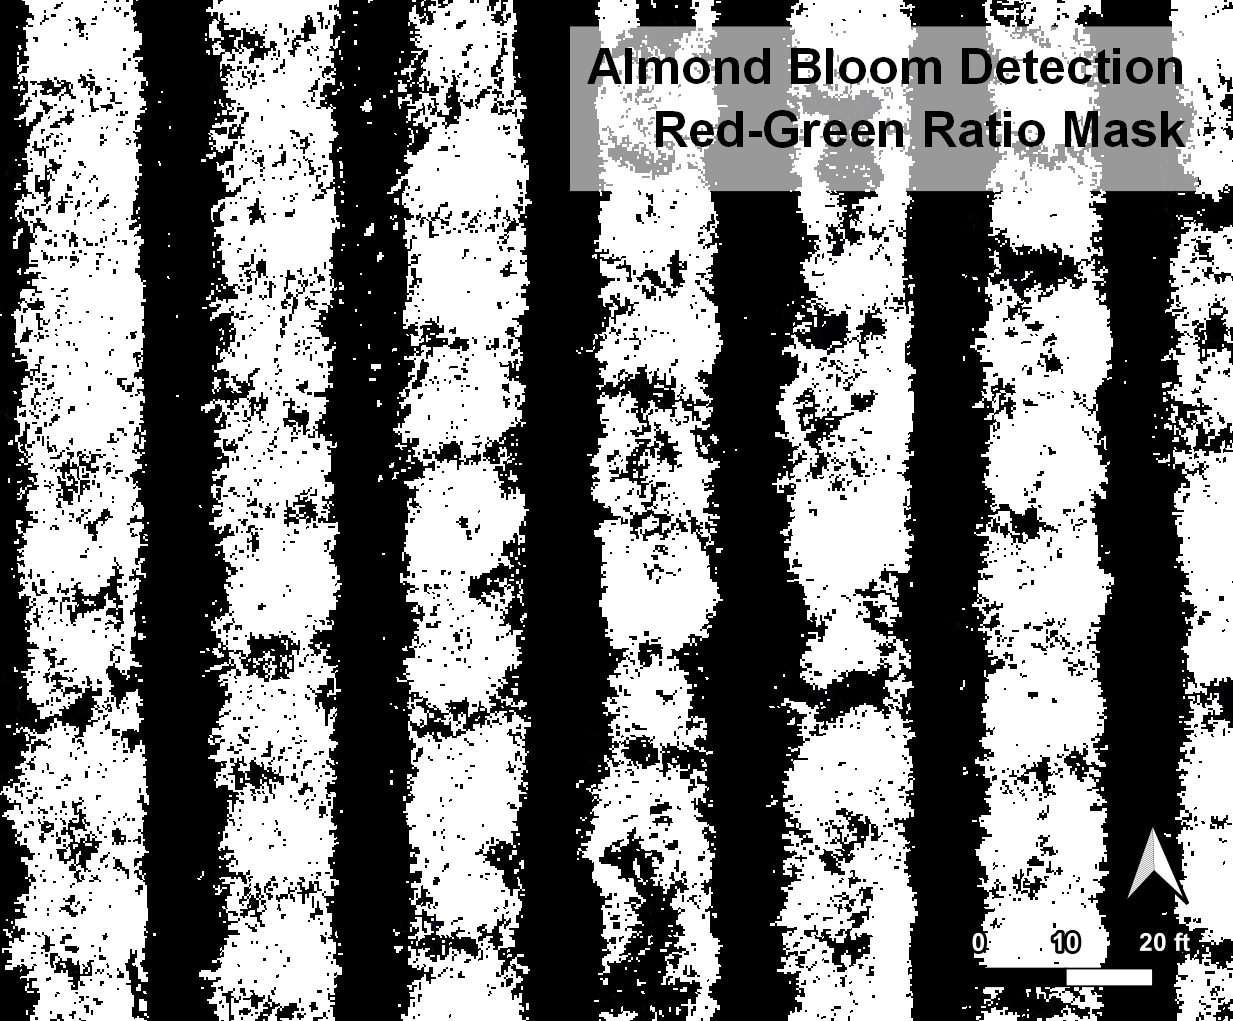
Our model works within a defined threshold of red and green color levels to filter out any pixels that don’t fit within the correct red-green ratio range for the bloom. In the result below, all white pixels are within the correct color range, while the black pixels are omitted from further analysis.

Bloom Sample Close with RG Mask

These steps are then repeated for the other wavelengths using sampled bloom pixel color values. The resulting mask layers are each used to filter out non-bloom pixels later in the process.

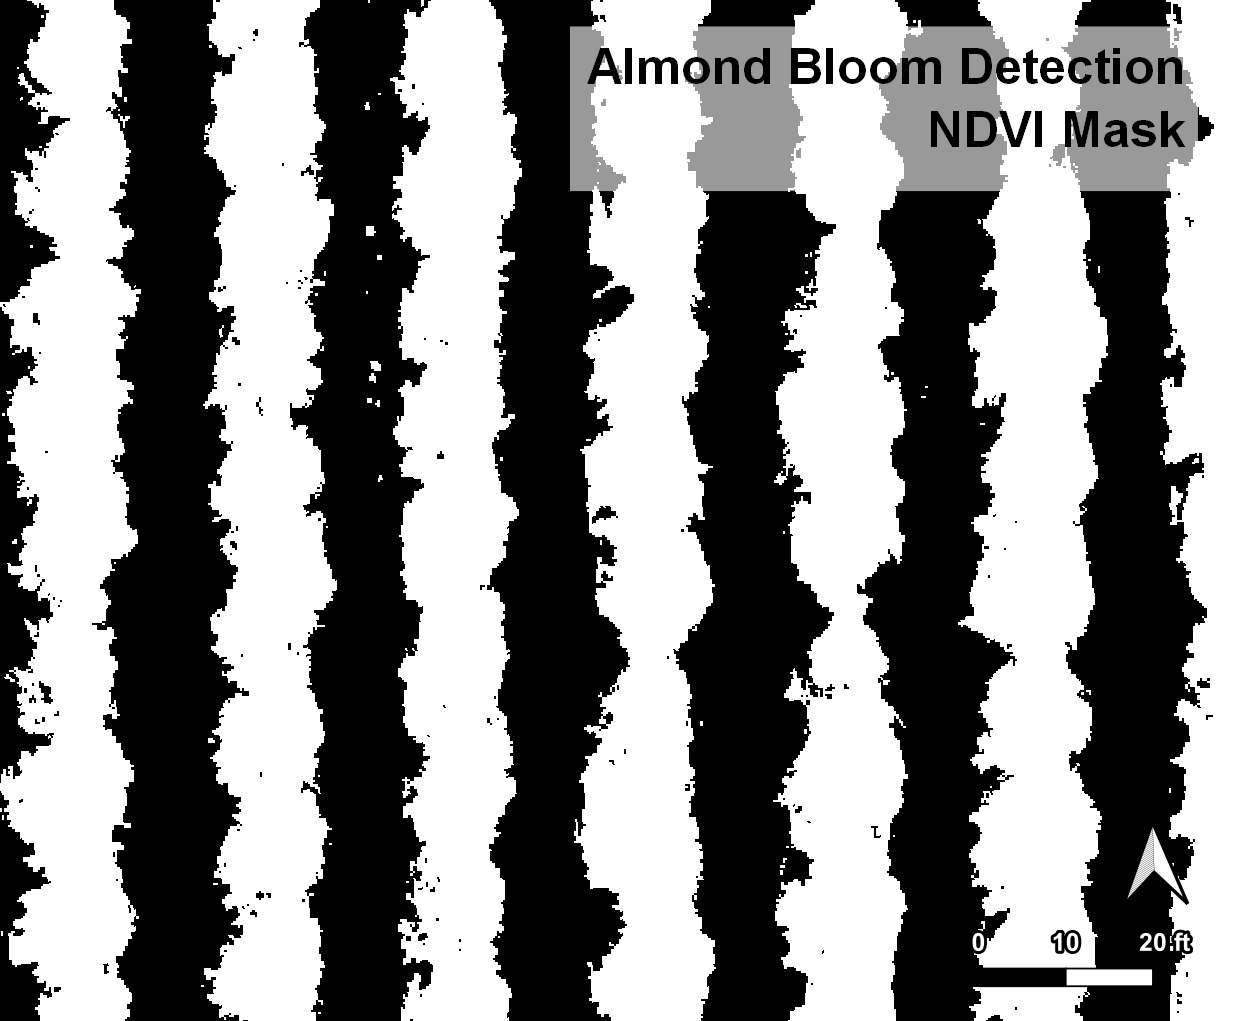
Not only do we use color readings in the visible light (red, green, and blue) wavelengths, but we also use near-infrared wavelengths invisible to the human eye to screen out soil pixels that could interfere with our results.

Bloom Sample Close with NDVI Mask

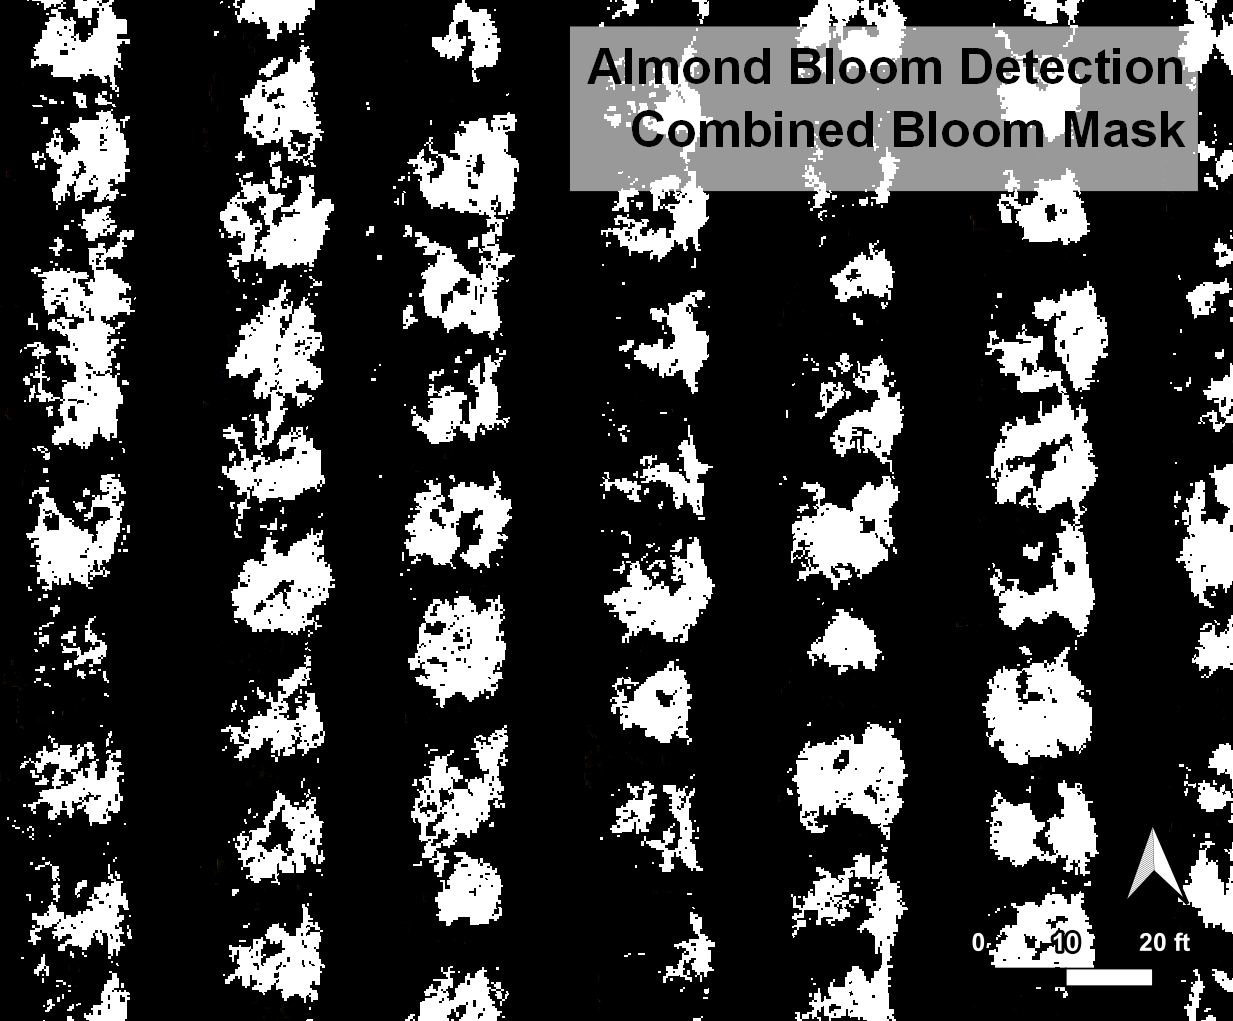
Finally, all mask layers are combined into a single mask that takes all bloom identification factors into account.

Bloom Sample Close with Bloom Mask

This layer then has our individual plant map placed on top so each tree’s bloom data has a unique identifier. From here, we can calculate the exposed surface area of all the blooms on each tree and report bloom uniformity across an entire orchard.

Bloom Sample Close with Pixel Circles

After ground truthing calibrations from representative trees in the orchard, growers can use this model to apply bloom protection measures and refine their yield estimates down to the individual tree. Drone data collection can be performed over an entire orchard in one day, dramatically reducing labor costs while optimizing sample size. These and many more actionable insights are how Pollen Systems can help growers produce higher yields and better crops. Reach out to our team today to learn how this technology can be applied in your field this season!
-->